
Gold, XAU/USD – Price Action & Outlook:XAU/USD rose sharply after US retail sales rose less than expected in June.Gold has met the bullish reverse
Gold, XAU/USD – Price Action & Outlook:
- XAU/USD rose sharply after US retail sales rose less than expected in June.
- Gold has met the bullish reverse head & shoulders pattern.
- What’s next for the yellow metal and what are the key levels to watch in XAU/USD?

Discover what kind of forex trader you are
Gold jumped after US retail sales rose less than expected in June which weighed on US Treasury yields and the greenback.
Even though headline retail sales came in below expectations, underlying consumer spending appeared to be strong, thanks to a tight labour market. The mixed retail sales report follows softer US CPI and PPI data. However, broader economic data, as measured by the Economic Surprise Index, continues to be solid – the US ESI hit a two-year high earlier this month before retreating slightly.
The outsized response in the US dollar to softer inflation and retail sales, which still portrayed a resilient economy, suggests the market is in no mood to buy the dollar amid a growing perception that the Fed is close to wrapping up its tightening cycle.
Rate futures are showing a 99% chance of a quarter percentage point hike at the July 25-26 meeting, according to the CME FedWatch tool. However, the market is pricing in rate cuts starting around mid-2024, with nearly 5 rate cuts by the end of next year. The market’s expectations contrast with the Fed’s projected two rate hikes before the year-end and no rate cuts until 2025.
XAU/USD 240-minute Chart
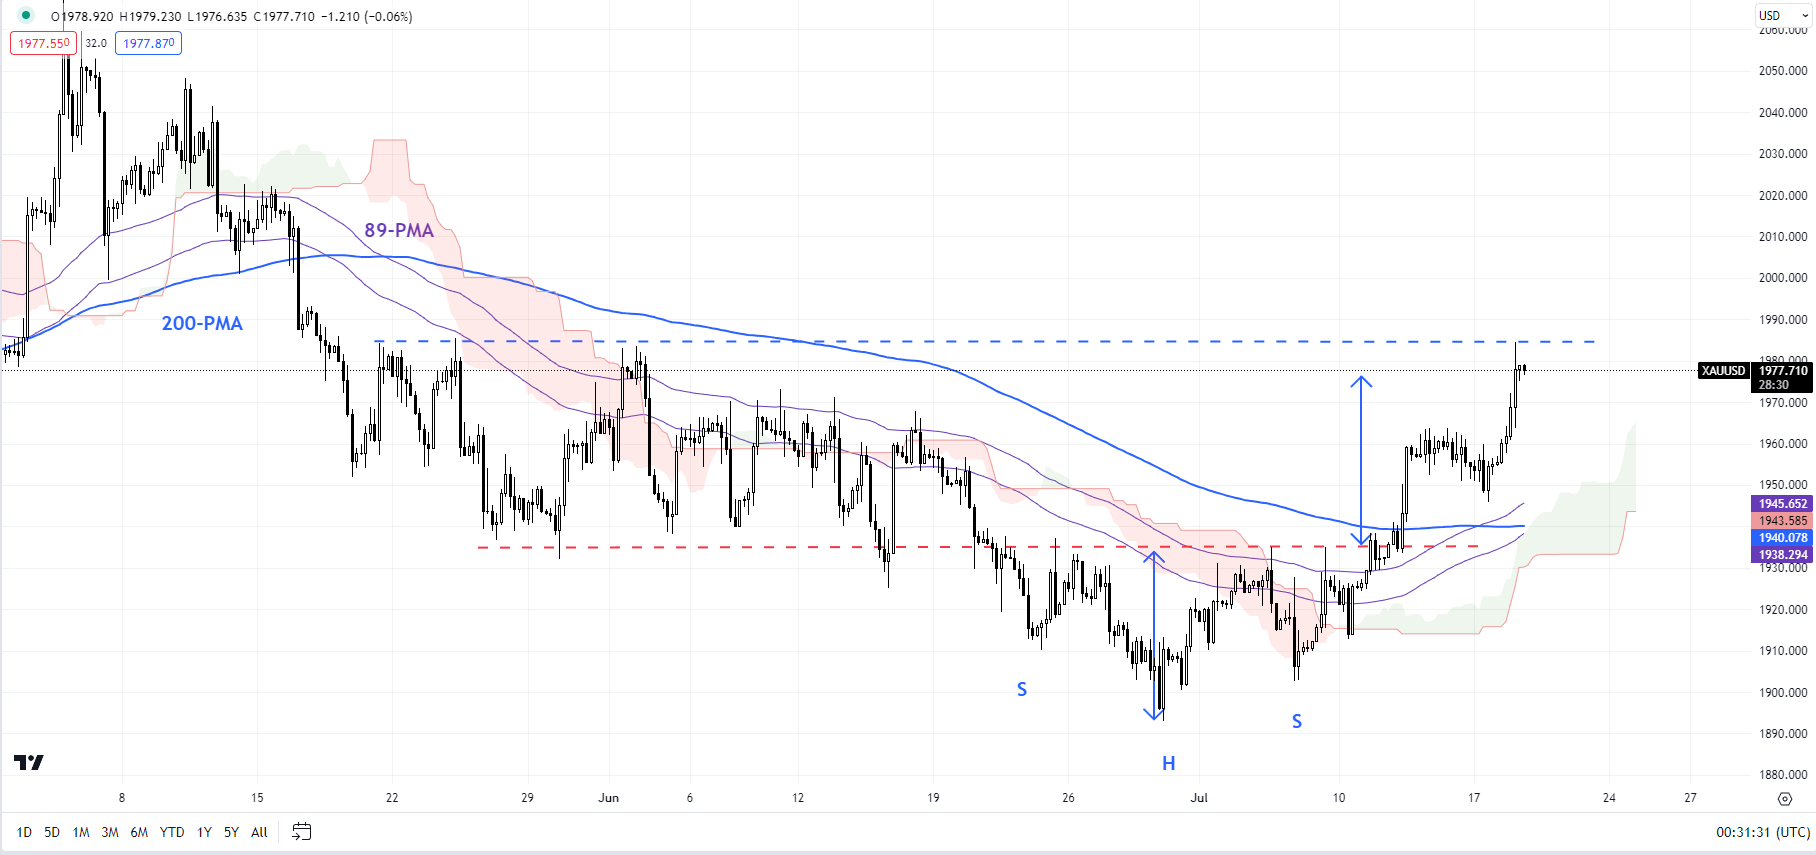
Chart Created by Manish Jaradi Using TradingView
US 10-year TIPS have retreated sharply since last week after US inflation data confirmed that price pressures are moderating. The rebound in gold mirrored the retreat in real yields – the yellow metal tends to move inversely with real yields (adjusted for inflation). A higher opportunity cost (real yields) tends to diminish the appeal of the yellow metal.
XAU/USD Daily Chart
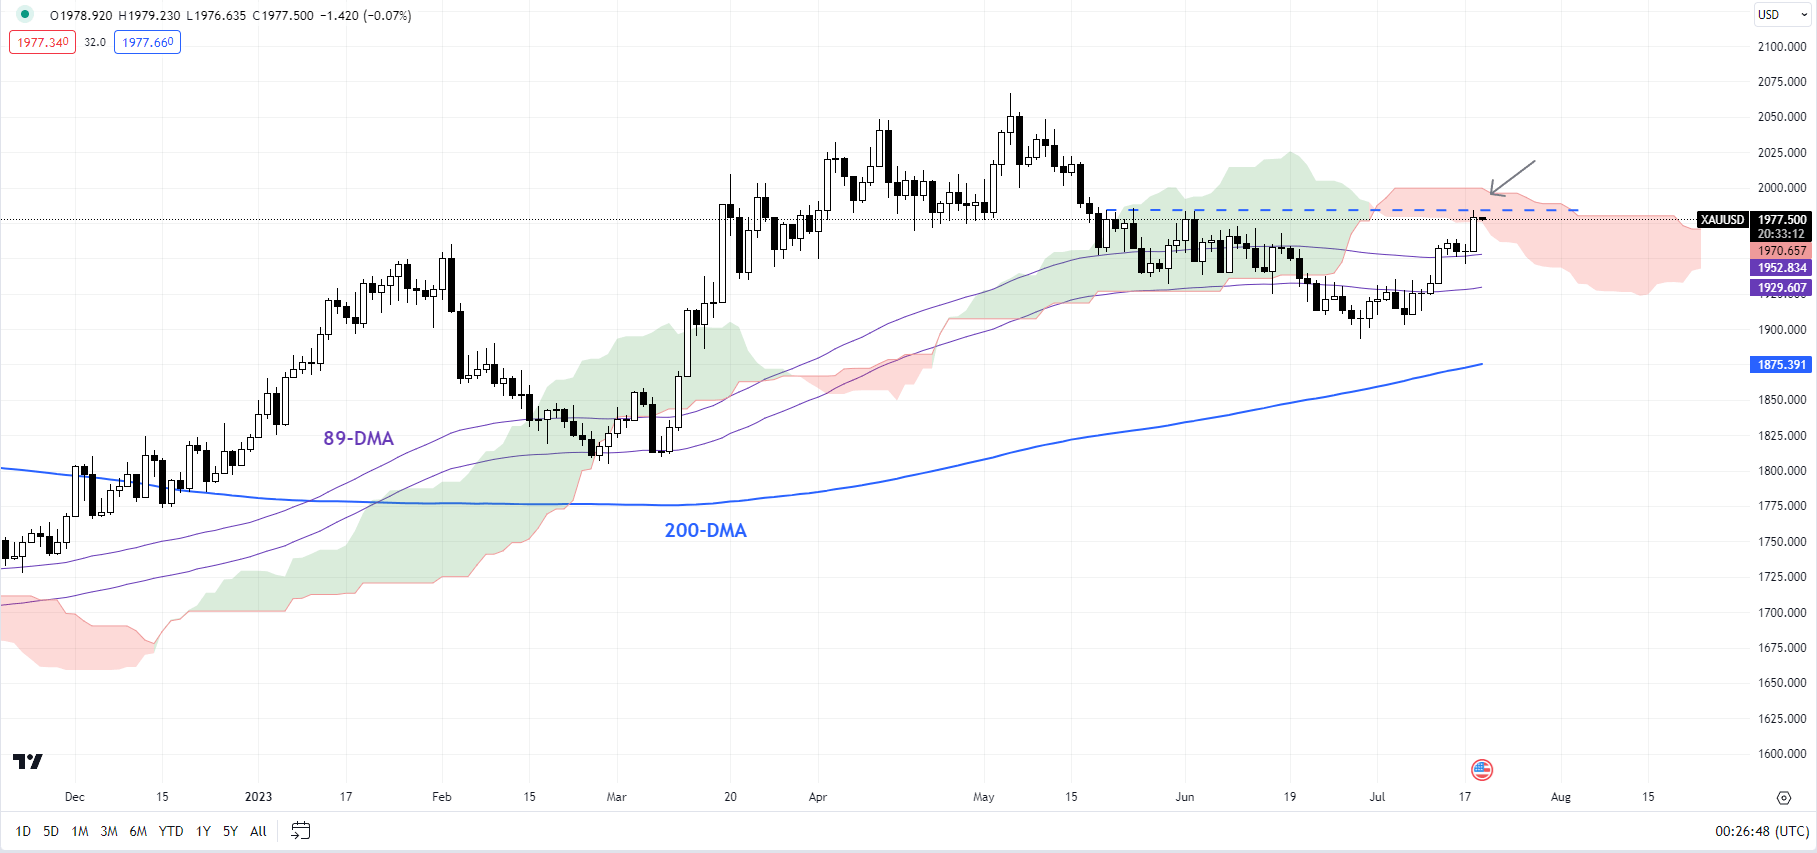
Chart Created by Manish Jaradi Using TradingView
On technical charts, XAU/USD has met the price objective of the minor reverse head & shoulders pattern triggered last week. See “Gold Boosted by US CPI; Reverse Head & Shoulders Triggers in XAU/USD,” published July 13. The left shoulder is at the late-June low, the head at the end-June low, and the right shoulder is at the early-July low. The price objective of the pattern is around 1980.
From a sentiment perspective, roughly 60% of the retail traders remain net-long gold, even though some of the longs have been scaled back recently, according to the IG Client Sentiment (IGCS).
XAU/USD is now testing a stiff barrier at the early-June high of 1983, slightly below the upper edge of the Ichimoku cloud on the daily charts (now around 1998). The momentum and the interim trend have decidedly turned up on intraday charts (notably, the upward-sloping 89-period moving average on the 240-minute charts). Still, gold would need to clear 1983-1998 for the medium-term downward pressure to fade.
Recommended by Manish Jaradi
Get Your Free Equities Forecast
— Written by Manish Jaradi, Strategist for DailyFX.com
— Contact and follow Jaradi on Twitter: @JaradiManish
element inside the
element. This is probably not what you meant to do!Load your application’s JavaScript bundle inside the element instead.
www.dailyfx.com