
Advertisement
Advertisement
Gold Price Forecast: Resistance at 2,031, Potential Pullback Ahead
By:
Gold rally to 2,031 meets resistance, signaling a possible pullback as it faces key technical levels and recent highs.
In this article:
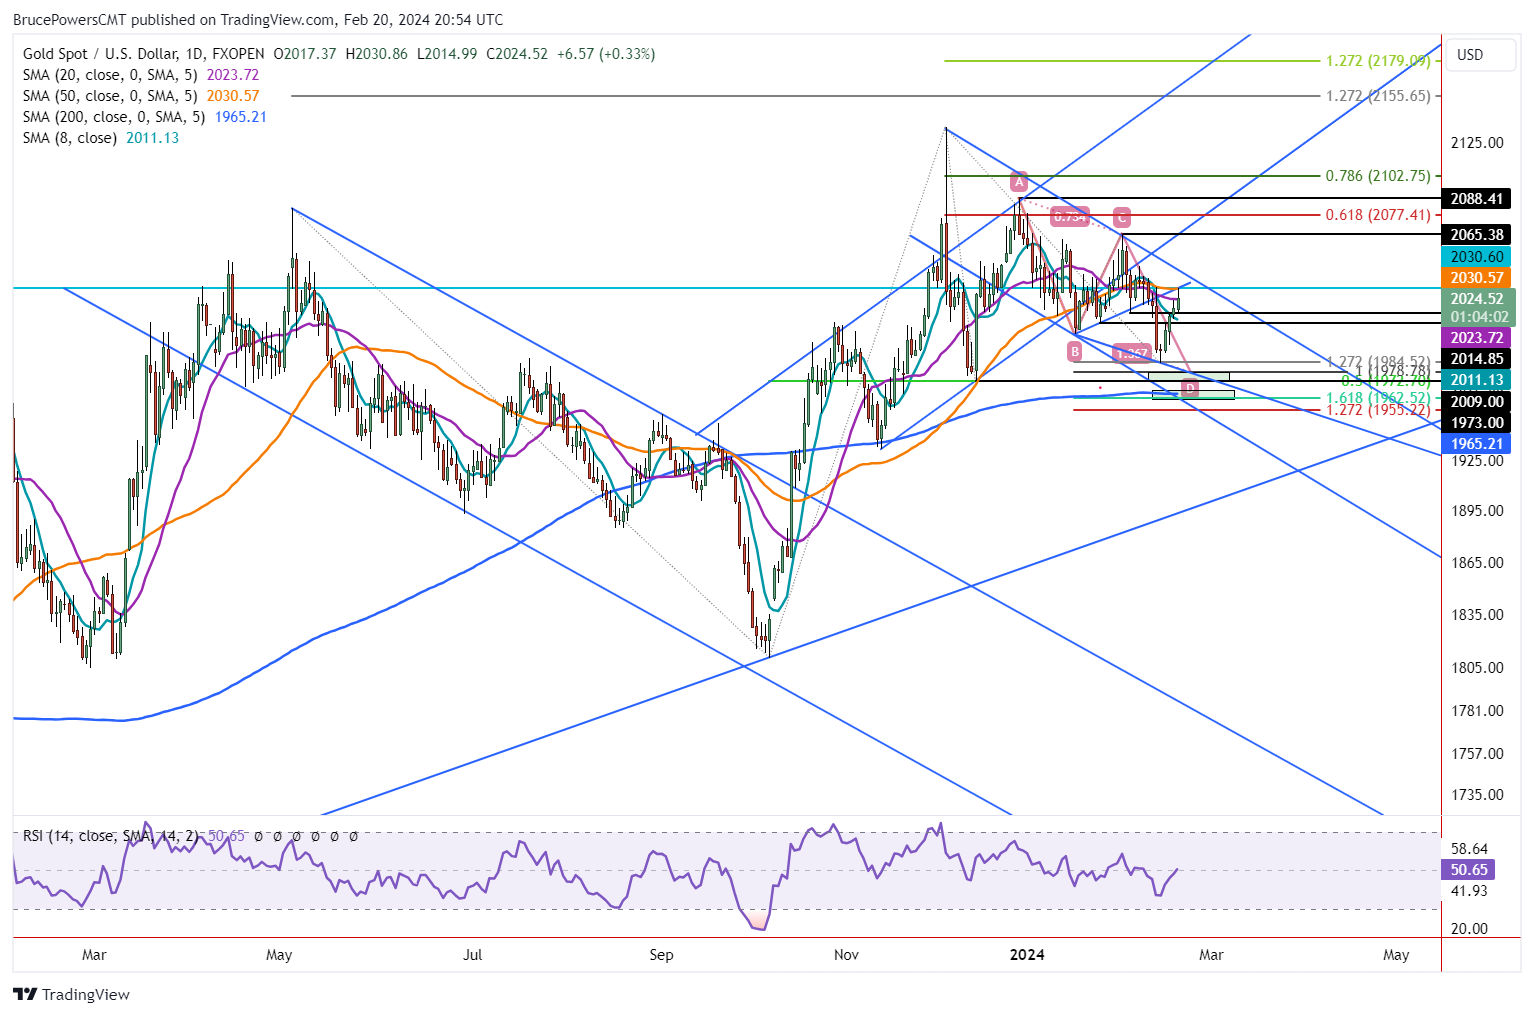
Gold continues to advance off the February 14 swing low with a new countertrend rally high of 2,031. That high reached the next previously noted target zone of 2,031. It completes a successful test of resistance at the combined 38.2% Fibonacci retracement and the 50-Day MA (orange) price zone. Also, it is notable that today’s high tested resistance of the prior internal trendline as well. Once the high was hit the sellers took over again, dropping the price of gold back towards the 50% area of the day’s high to low trading range. In other words, once the 2,031 target was hit, resistance kicked in.
50-Day Moving Average Marks Key Resistance
Today’s test of resistance at the 50-Day MA is the second time in two weeks that the line has triggered resistance and a selloff. Last week’s high also encountered resistance at the 50-Day line. Given today’s bearish reaction following the 2,031 high, it wouldn’t be surprising to see at least a minor pullback or consolidation as gold further digests recent gains.
Weekly Bull Hammer Setup
Gold completed a weekly bullish hammer candlestick pattern last week. On the upside, a breakout will trigger on a rally above last week’s high of 2,031. Of course, that would put gold in a stronger position as it will be at a two-week high and above both the 20-Day and 50-Day MAs. Subsequently, once a daily close occurs above 2,031 gold will be cleared to contend with higher price targets. The first being around the prior swing high at 2,065 (C). That price target is followed by the 2,088-price zone derived from December 28 swing high (A).
Daily Close Above 2,065 Opens Door to New Highs
A daily close above the 2,065-swing high will further confirm a bullish reversal of the recent lows and strength in the developing uptrend. It is part of the price structure of the downtrend and once exceeded to the upside the downtrend structure is busted. At that point the chance that gold will test and possibly exceed the record high of 2,135 from December improves significantly. Until then, gold could continue to struggle.
On the downside, a drop below the three-day low of 1,995 will put the recent 1,985 swing low at risk of being tested again and possibly exceeded to the downside. If that happens, the next lower area to watch for support is from around 1,979 to 1,973.
For a look at all of today’s economic events, check out our economic calendar.
About the Author
Bruce Powersauthor
Bruce boasts over 20 years in financial markets, holding senior roles such as Head of Trading Strategy at Relentless 13 Capital and Corporate Advisor at Chronos Futures. A CMT® charter holder and MBA in Finance, he's a renowned analyst and media figure, appearing on 150+ TV business shows.
Did you find this article useful?
Latest news and analysis


Advertisement