
Gold, XAU/USD – Price Action & Outlook:
- Gold appears to be losing ground amid rising real yields.
- Most recently, XAU/USD has fallen below key support, accentuating downside risks.
- What are the key levels to watch in XAU/USD?

Higher real rates could be starting to finally weigh on gold prices. Real yields have been elevated on rising nominal interest rates, moderating price pressures/inflation expectations amid the growing perception of the ‘higher-for-longer' interest rates.
Gold Vs US 10-Year TIPS yield
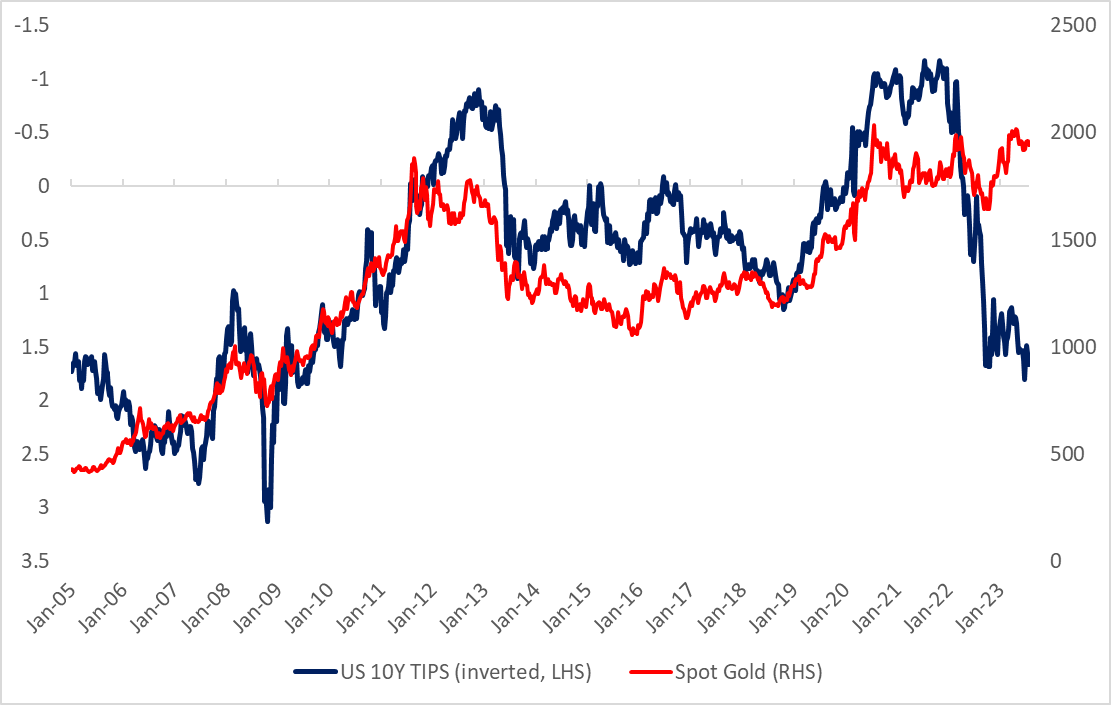
Source Data: Bloomberg; chart created in Microsoft Excel
In contrast, gold has stayed broadly in a range, widening the gap with real yields. Gold is a non-interest, non-coupon-bearing asset, and positive real yields tend to increase the opportunity cost of holding the zero-yielding yellow metal.
XAU/USD 240-minute Chart
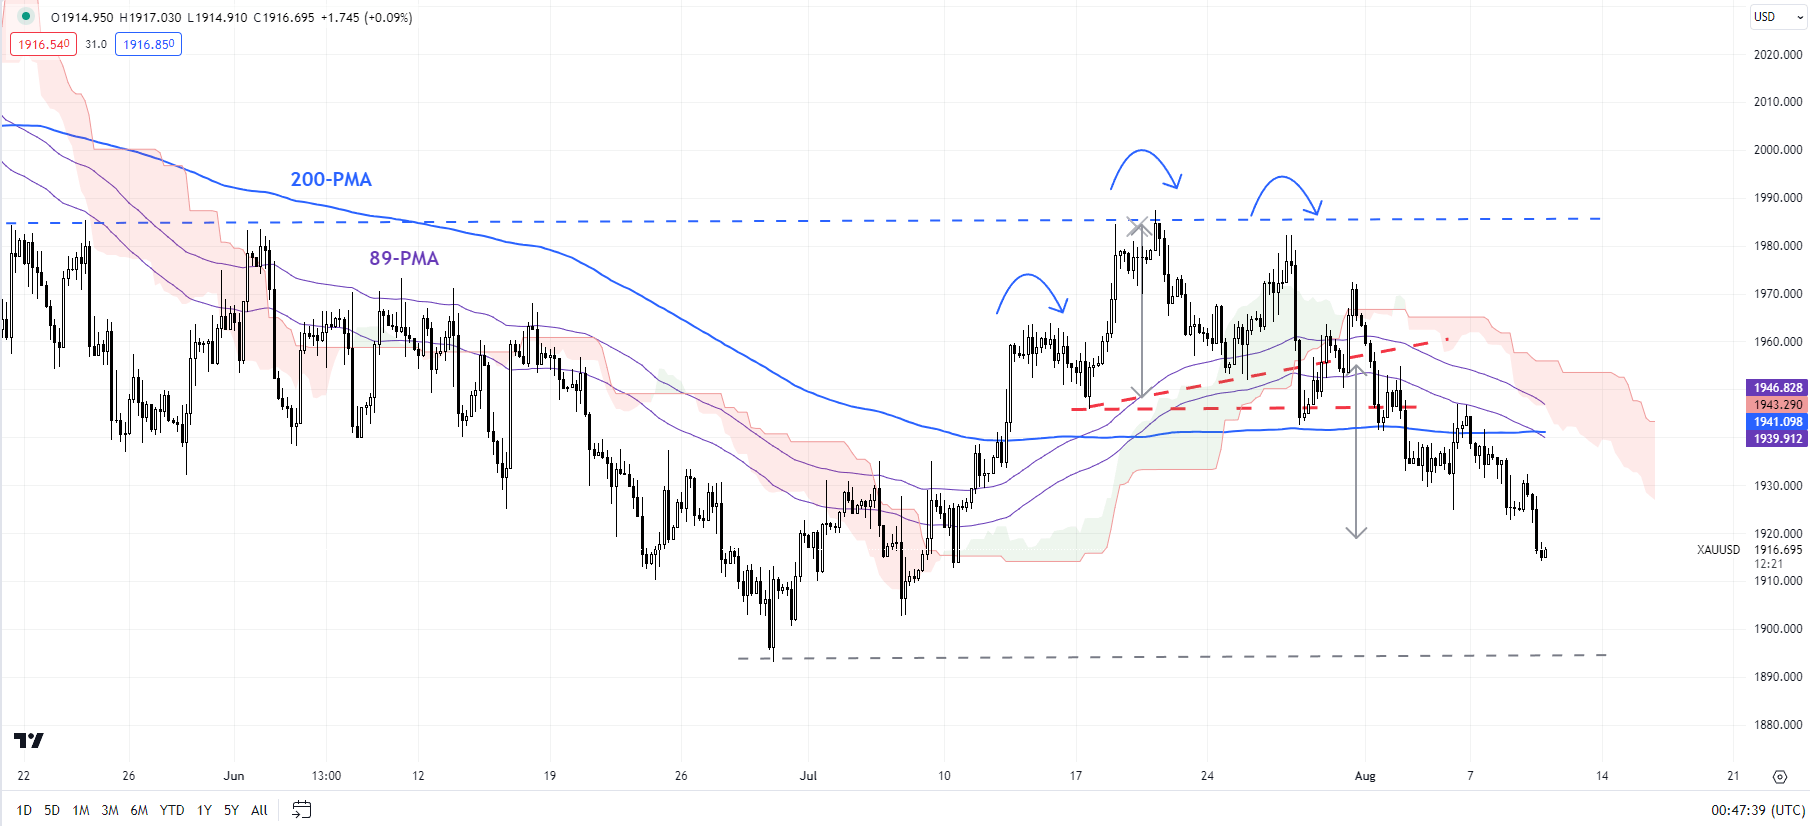
Chart Created by Manish Jaradi Using TradingView
On technical charts, XAU/USD fall below crucial converged support, including the mid-July low of 1945 and the late-July lows of 1953, has opened the way toward the June low of 1892 – a risk pointed out in the previous update. See “Gold and Silver Forecast: Rate Hikes Weigh on XAU/USD, XAG/USD,” published July 30. The lower-top-lower-bottom since late July indicates the June-July uptrend is over as indicated on the four-hour chart. (See the 240-minute chart.)
XAU/USD Daily Chart
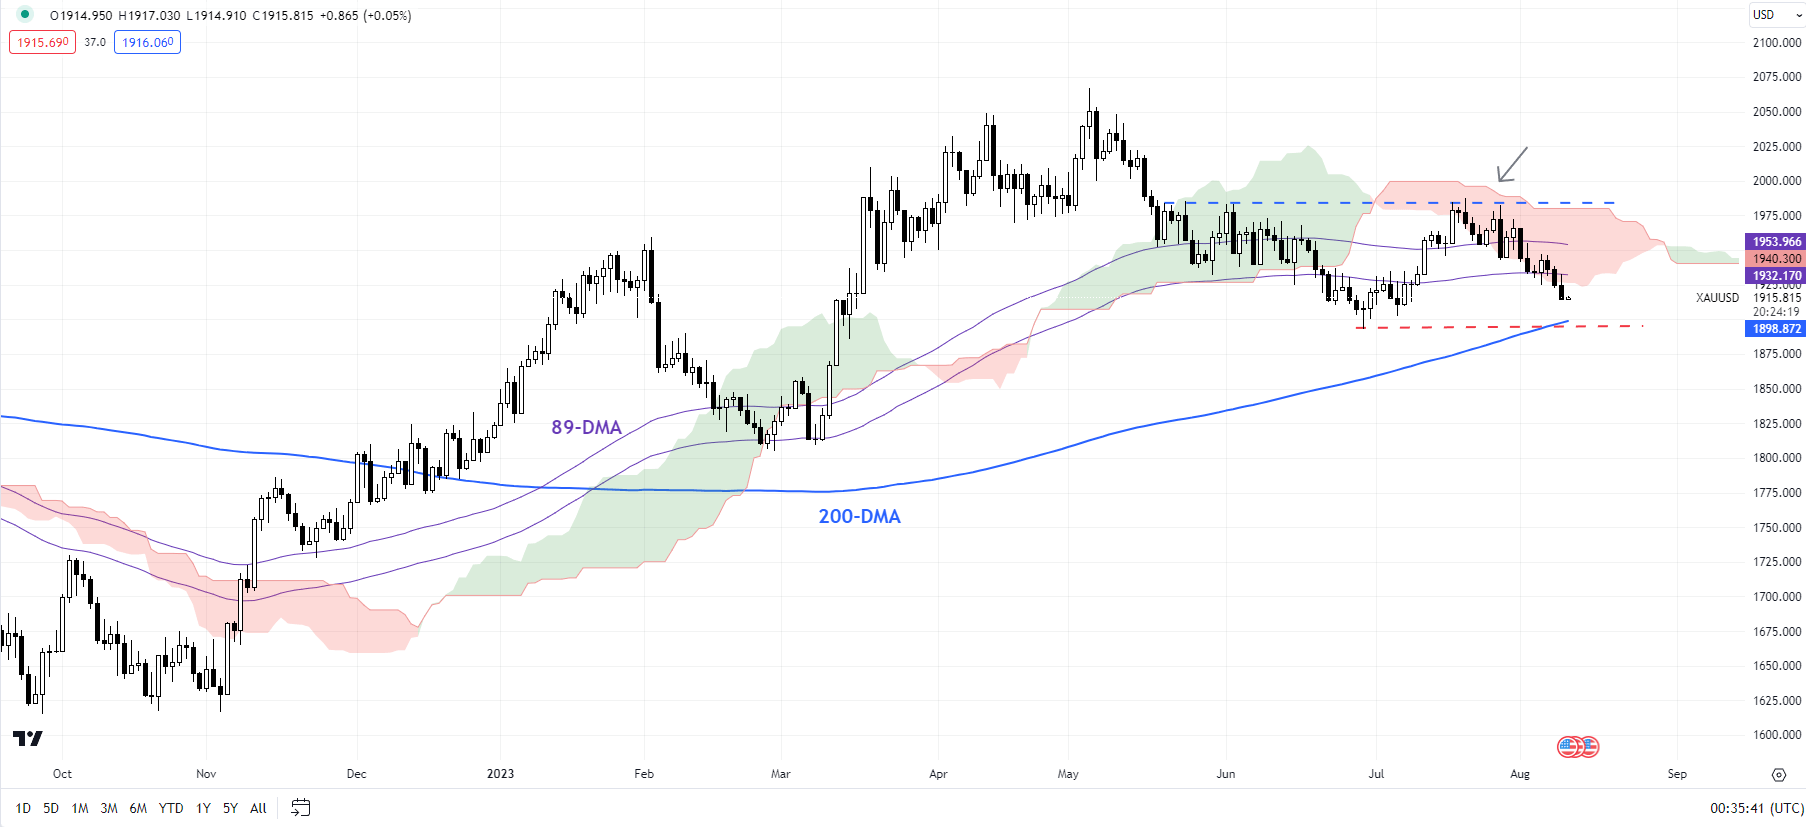
Chart Created by Manish Jaradi Using TradingView
This follows a failed attempt in mid-July to rise above stiff resistance at the early-June high of 1983, slightly below the upper edge of the Ichimoku cloud on the daily charts – a risk pointed out in late July. See “Is Gold’s Rebound Over Ahead of FOMC? XAU/USD Price Setups,” published July 25.
XAU/USD Weekly Chart
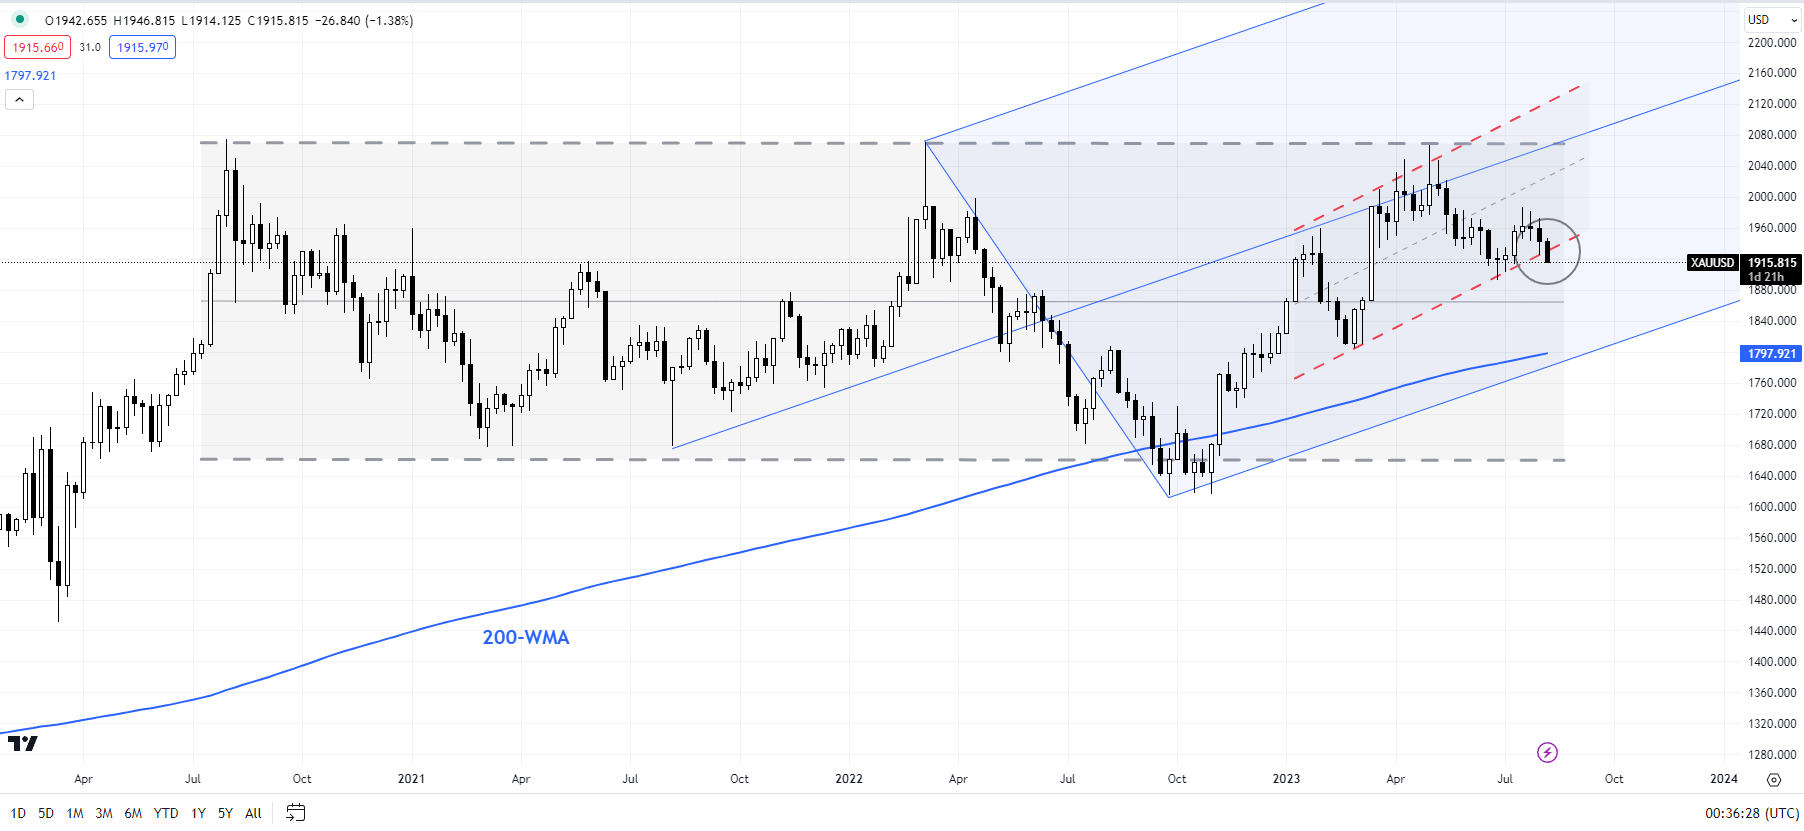
Chart Created by Manish Jaradi Using TradingView
XAU/USD is now testing a vital cushion on the 200-day moving average, the June low, and the lower edge of a rising channel since early 2023 (see the weekly chart). Any break below could pave the way toward the February low of 1805. Importantly, it would reinforce the bearish developments on higher timeframe charts in recent months. See “Gold Could Find It Tough to Crack $2000”,published March 28, and “Gold Weekly Forecast: Is it Time to Turn Cautious on XAU/USD?” published April 16.

--- Written by Manish Jaradi, Strategist for DailyFX.com
--- Contact and follow Jaradi on Twitter: @JaradiManish