
Long-established in the Travel & Leisure industry, Wynn Resorts Ltd (WYNN, Financial) has enjoyed a stellar reputation. However, it has recently witnessed a daily loss of 1.53%, juxtaposed with a three-month change of -13.09%. Fresh insights from the GF Score hint at potential headwinds. Notably, its diminished rankings in financial strength, growth, and valuation suggest that the company might not live up to its historical performance. Join us as we dive deep into these pivotal metrics to unravel the evolving narrative of Wynn Resorts Ltd.
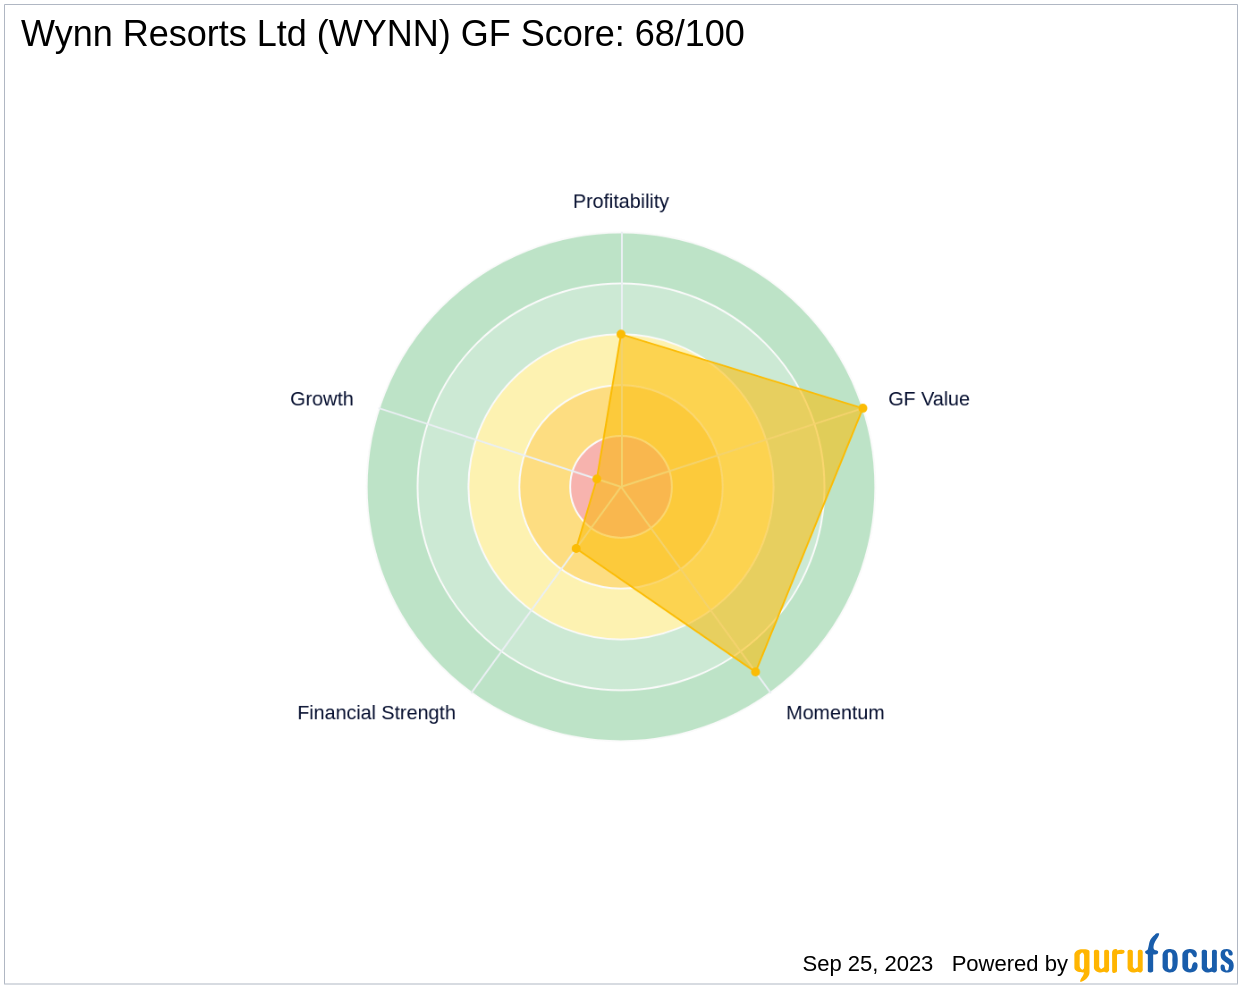
Understanding the GF Score
The GF Score is a stock performance ranking system developed by GuruFocus using five aspects of valuation, which has been found to be closely correlated to the long-term performances of stocks by backtesting from 2006 to 2021. The stocks with a higher GF Score generally generate higher returns than those with a lower GF Score. Therefore, when picking stocks, investors should invest in companies with high GF Scores. The GF Score ranges from 0 to 100, with 100 as the highest rank.
- Financial strength rank: 3/10
- Profitability rank: 6/10
- Growth rank: 1/10
- GF Value rank: 10/10
- Momentum rank: 9/10
Based on the above method, GuruFocus assigned Wynn Resorts Ltd the GF Score of 68 out of 100, which signals poor future outperformance potential.
Wynn Resorts Ltd: A Snapshot of Its Business
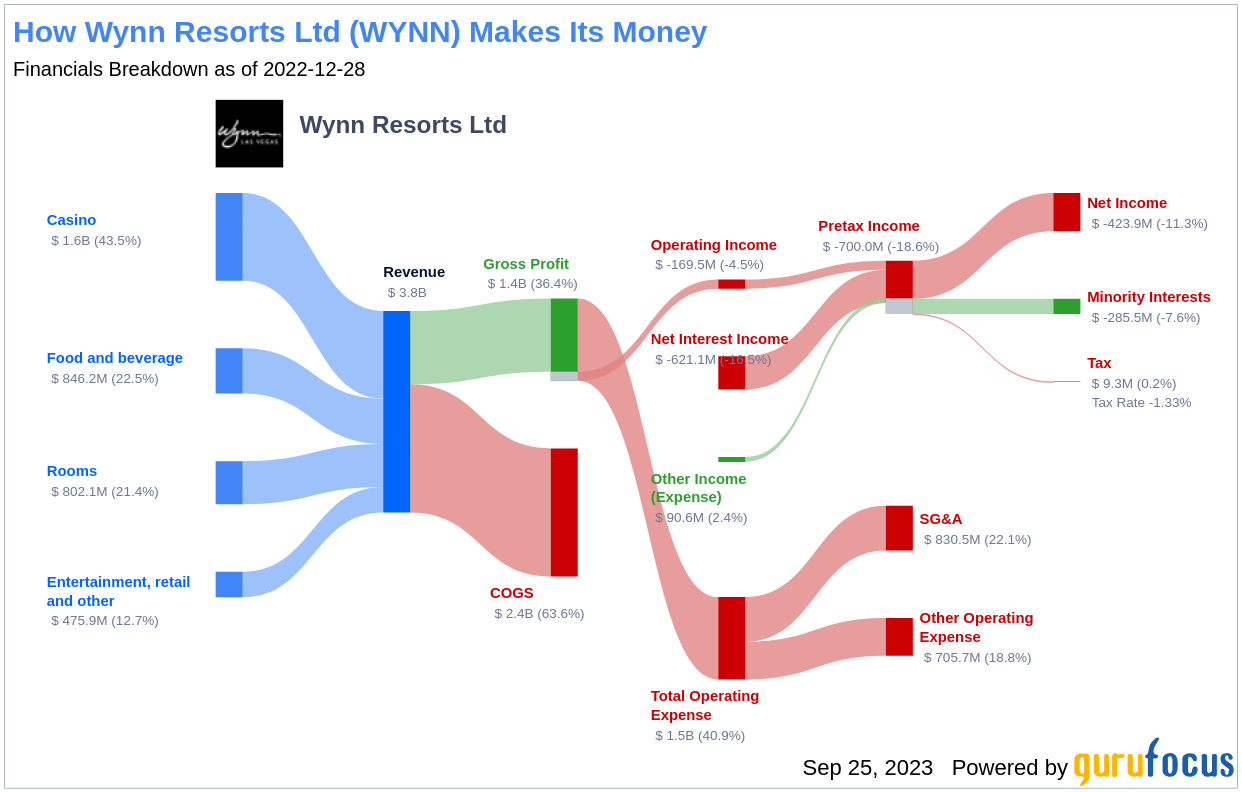
Wynn Resorts Ltd, with a market cap of $10.27 billion, operates luxury casinos and resorts. Founded in 2002 by Steve Wynn, the company runs four megaresorts: Wynn Macau and Encore in Macau and Wynn Las Vegas and Encore in Las Vegas. The company also operates Wynn Interactive, a digital sports betting and iGaming platform. In 2019, the company received 76% and 24% of its pre-pandemic EBITDA from Macau and Las Vegas, respectively.
Financial Strength Breakdown
Wynn Resorts Ltd's financial strength indicators present some concerning insights about the company's balance sheet health. The company's interest coverage ratio of 0.48 positions it worse than 91.74% of 569 companies in the Travel & Leisure industry. This ratio highlights potential challenges the company might face when handling its interest expenses on outstanding debt.
The company's Altman Z-Score is just 0.91, which is below the distress zone of 1.81. This suggests that the company may face financial distress over the next few years. Additionally, the company's low cash-to-debt ratio at 0.29 indicates a struggle in handling existing debt levels. Furthermore, the company's debt-to-Ebitda ratio is 10.53, which is above Joel Tillinghast's warning level of 4 and is worse than 83.61% of 592 companies in the Travel & Leisure industry.
Growth Prospects
A lack of significant growth is another area where Wynn Resorts Ltd seems to falter, as evidenced by the company's low Growth rank. The company's revenue has declined by -18.8 per year over the past three years, which underperforms worse than 78.93% of 769 companies in the Travel & Leisure industry. Stagnating revenues may pose concerns in a fast-evolving market. Lastly, Wynn Resorts Ltd predictability rank is just one star out of five, adding to investor uncertainty regarding revenue and earnings consistency.

Conclusion
Given Wynn Resorts Ltd's financial strength, profitability, and growth metrics, the GF Score highlights the firm's unparalleled position for potential underperformance. While the company has a rich history and a strong presence in the Travel & Leisure industry, its current financial indicators and growth prospects suggest that it may struggle to maintain its past performance. Investors should consider these factors when making investment decisions.
GuruFocus Premium members can find more companies with strong GF Scores using the following screener link: GF Score Screen