
Advertisement
Advertisement
Gold’s Price Movement: Comparing the Present to 2022’s Rally
By:
Exploring parallels with the 2022 rally, the current gold advance exhibits similarities, raising questions about potential patterns and retracements.

In this article:
Gold Forecast Video for 02.11.23 by Bruce Powers
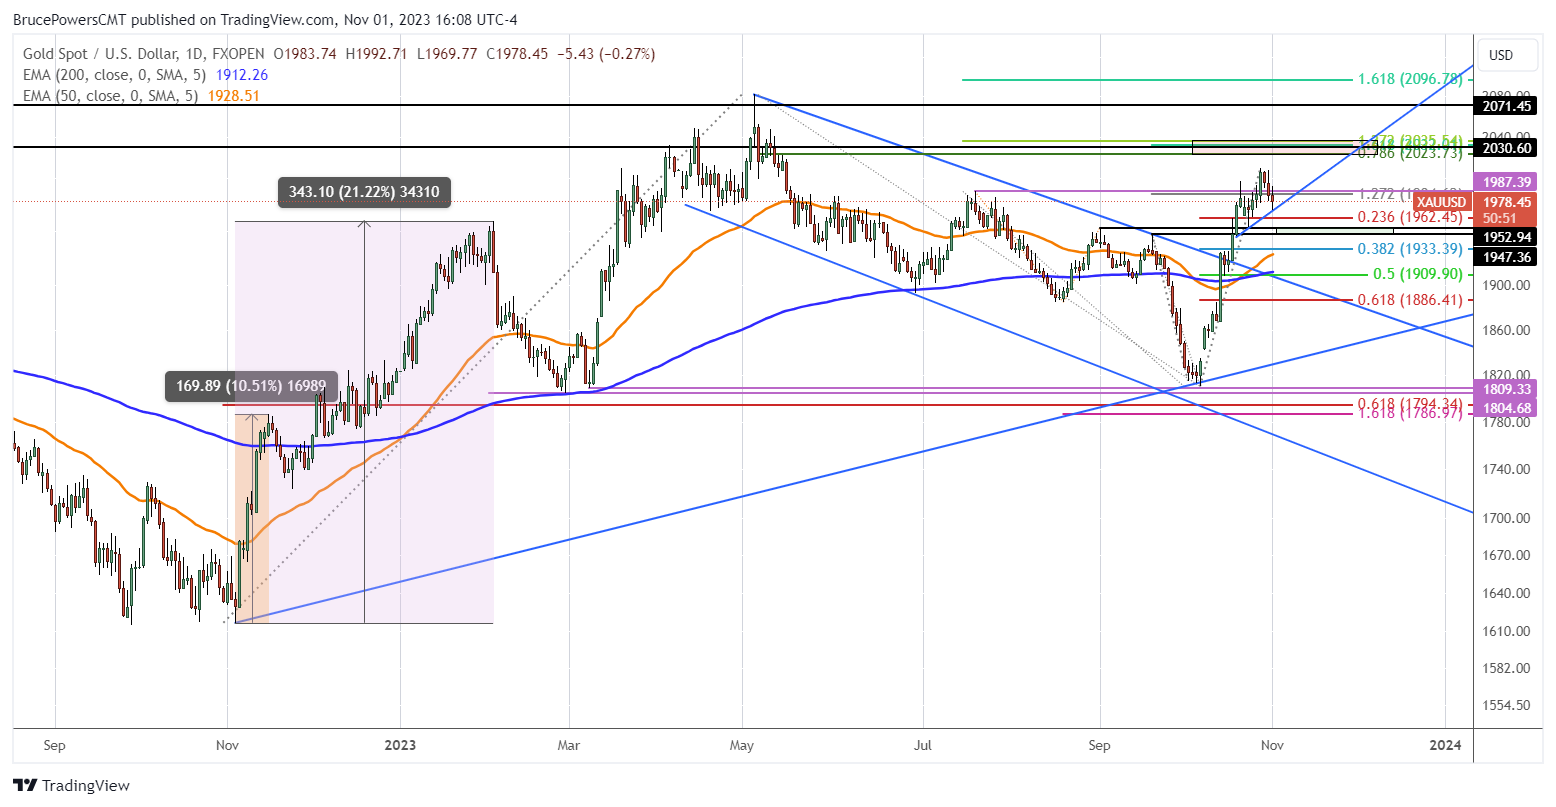
Gold retraced further today, falling to a five-day low of 1,970 before bouncing. Selling has been muted so far given the shallow retracement of less than the 23.6% Fibonacci level.
Watching Key 1,987 Near Term Price Level
A key near term price level is at the swing high of 1,987 from July. Gold managed to close above it over two days following the rally above it but couldn’t hold on longer. Today is on track to close below that level as well as yesterday. The July swing high is part of the downtrend price structure and a daily close above it shows strength and further confirms the completion of the correction.
Similarities to Impulse Leg Up at Start of Uptrend
It is possible that the current advance will be like the rally at the beginning of the uptrend started a year ago in early-November 2022. An impulse leg (relatively sharp quick rally) began the advance. The initial advance was 10.5% in only eight days. In the current rally gold was up 10.2% at the of the October 20 swing high (impulse leg). That advance occurred in only 10 days. Since then, we have seen prices rising but at a slower choppy pace. This can be referred to as upward sloping consolidation. You can see how a similar rising consolidation pattern began following the impulse leg in 2022.
Following November 23, 2023, swing low, gold proceeded higher but at a much slower pace. Retracements on the way up were minimal, reflecting sustained demand. This went on for about 30 trading days. Eventually, demand spiked again around January 6 of this year, leading to an acceleration in price appreciation until the swing high on February 2. The full rally to the February swing high was 21.2%. A similar move in the current rally would have gold hitting 2,173. It took 64 trading days for gold to advance 21.2%.
Deeper Retracement Busts Analog
The above analog allows for a deeper retracement in the current advance. We’ll be watching carefully if similar progress to 2022 continues to develop. Given recent trading, it looks like a drop below 1,953 minor swing low would question the relationship.
For a look at all of today’s economic events, check out our economic calendar.
About the Author
Bruce Powersauthor
Bruce boasts over 20 years in financial markets, holding senior roles such as Head of Trading Strategy at Relentless 13 Capital and Corporate Advisor at Chronos Futures. A CMT® charter holder and MBA in Finance, he's a renowned analyst and media figure, appearing on 150+ TV business shows.
Did you find this article useful?
Latest news and analysis


Advertisement