

With a daily gain of 0.38% and a three-month loss of -2.3%, investors might wonder if Baker Hughes Co (BKR, Financial) is keeping pace with industry standards. The company's Earnings Per Share (EPS) (EPS) stands at 1.66, prompting the question: Is the stock modestly overvalued? This article delves into the valuation analysis of Baker Hughes Co, encouraging readers to explore the financial nuances that determine its market standing.
Company Introduction
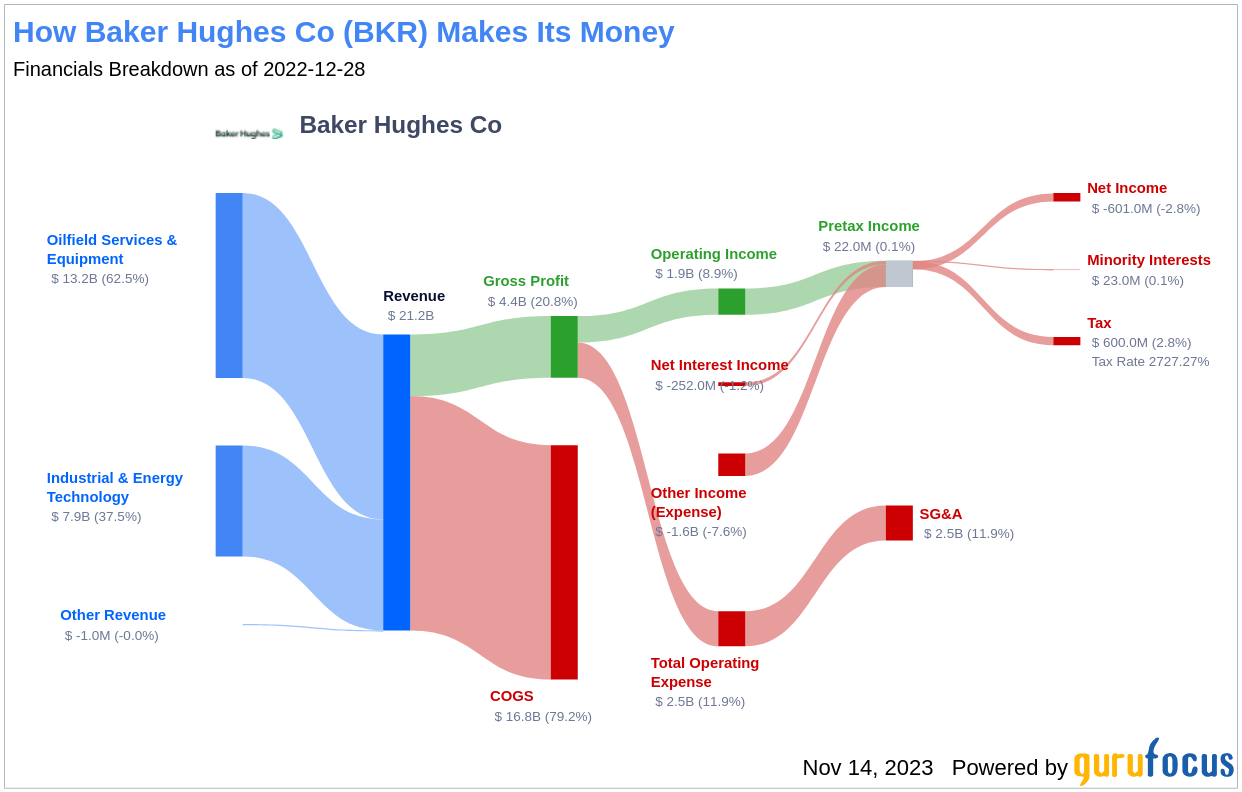
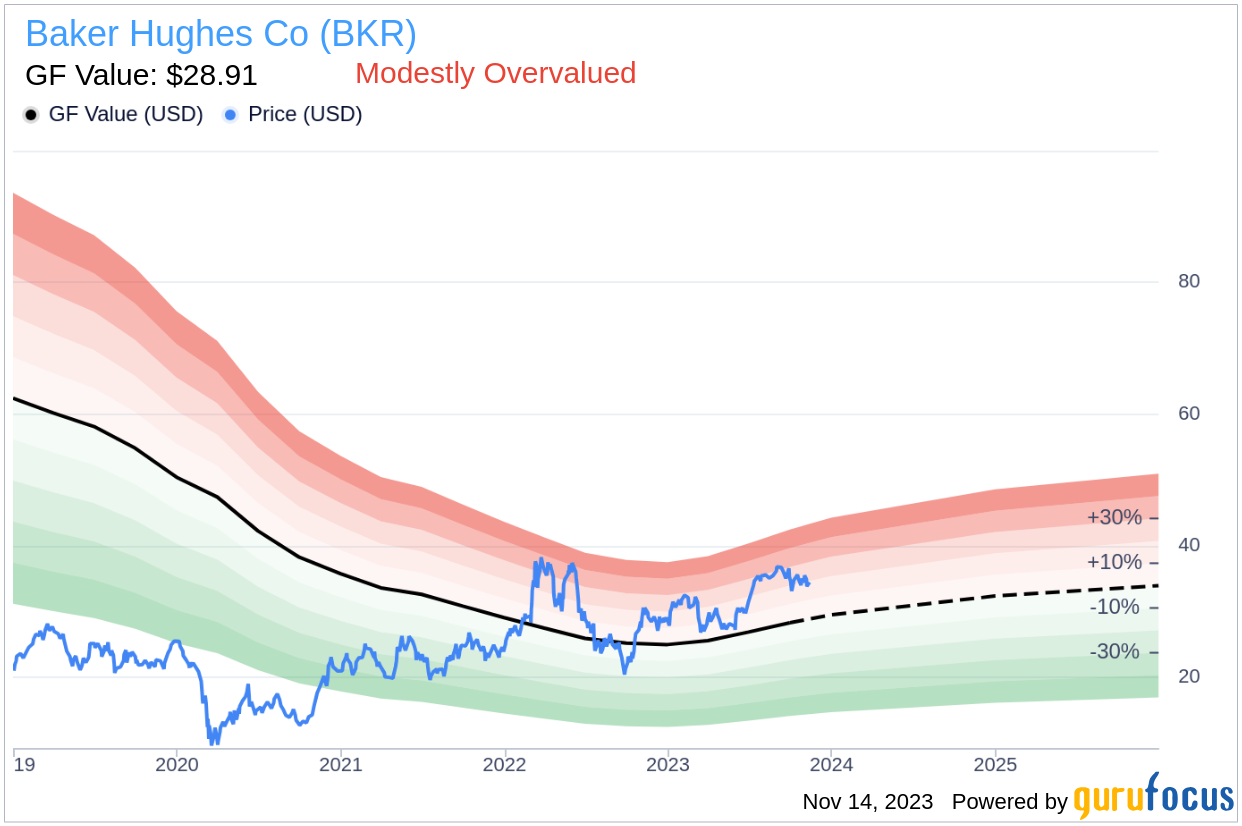
Baker Hughes Co is a formidable player in the oilfield services and equipment sector, with a notable presence in artificial lift, specialty chemicals, and completions markets. Its operations span industrial power generation, process solutions, and asset management, with significant involvement in the liquid natural gas market. With a current stock price of $34.47 and a GF Value of $28.91, there's a compelling narrative about the company's valuation to be explored.
Understanding GF Value
The GF Value is a unique metric, reflecting the intrinsic value of a stock based on historical trading multiples, a GuruFocus adjustment factor, and future business performance estimates. It suggests the fair trading value of a stock, with deviations indicating potential overvaluation or undervaluation. Baker Hughes Co's current market cap of $34.70 billion suggests a modest overvaluation compared to our GF Value estimate.
Investors should note that due to this overvaluation, the long-term return potential of Baker Hughes Co's stock may not align with the company's business growth trajectory.
Link: These companies may deliver higher future returns at reduced risk.
Financial Strength Assessment
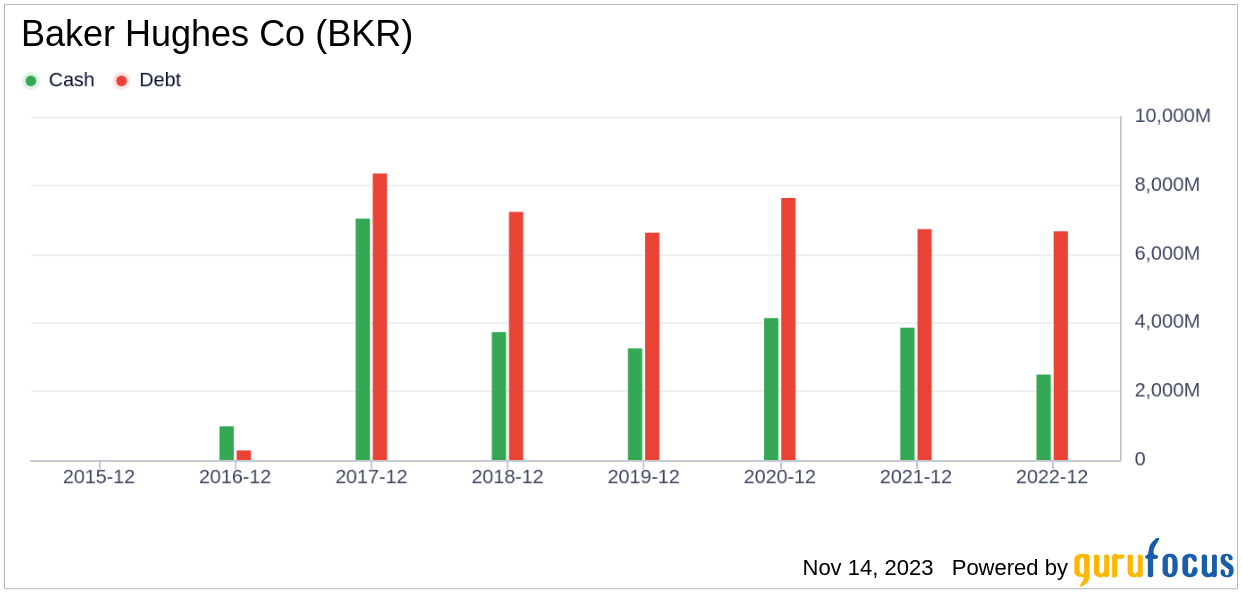
Assessing a company's financial strength is crucial to avoid the risk of permanent capital loss. Baker Hughes Co's cash-to-debt ratio of 0.48 ranks it in the lower half of the Oil & Gas industry. However, its overall financial strength score of 6 out of 10 indicates a fair position in terms of financial stability.
Profitability and Growth Analysis
Consistent profitability is a key indicator of lower investment risk. Baker Hughes Co's operating margin of 10.25% demonstrates moderate profitability, higher than over half of its competitors in the Oil & Gas industry. Yet, the company's growth metrics reveal challenges, with revenue and EBITDA growth rates trailing significantly behind industry averages.
Evaluating ROIC vs. WACC
Comparing Return on Invested Capital (ROIC) with the Weighted Average Cost of Capital (WACC) provides insight into value creation for shareholders. Baker Hughes Co's ROIC of 6.17 is below its WACC of 9.87, suggesting that the company may not be generating sufficient returns on its investments.

Conclusion
In conclusion, Baker Hughes Co (BKR, Financial) appears to be modestly overvalued. The company maintains fair financial health and profitability, yet its growth prospects are less promising compared to its peers in the Oil & Gas industry. For a deeper understanding of Baker Hughes Co's financials, interested investors can refer to its 30-Year Financials here.
To discover high-quality companies that may offer above-average returns, please check out the GuruFocus High Quality Low Capex Screener.
This article, generated by GuruFocus, is designed to provide general insights and is not tailored financial advice. Our commentary is rooted in historical data and analyst projections, utilizing an impartial methodology, and is not intended to serve as specific investment guidance. It does not formulate a recommendation to purchase or divest any stock and does not consider individual investment objectives or financial circumstances. Our objective is to deliver long-term, fundamental data-driven analysis. Be aware that our analysis might not incorporate the most recent, price-sensitive company announcements or qualitative information. GuruFocus holds no position in the stocks mentioned herein.