

Hasbro Inc (HAS, Financial) witnessed a daily gain of 7.21% and a 3-month gain of 13.6%. Despite a reported Loss Per Share of 1.85, the stock appears to be modestly undervalued. This article aims to provide a comprehensive valuation analysis of Hasbro (HAS). Let's delve into the financials and future prospects of this company.
Introduction to Hasbro Inc
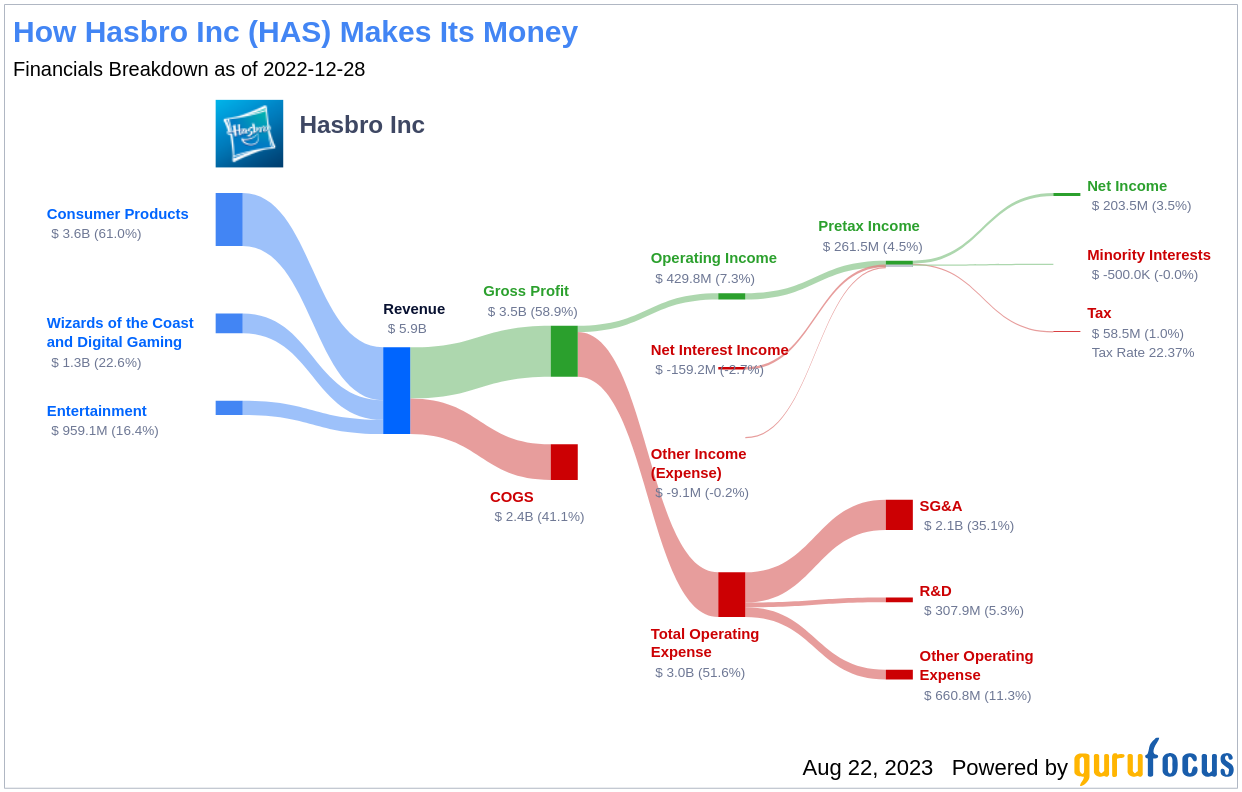
Hasbro is a globally recognized play company, offering a variety of entertainment solutions to children and families. Its diverse portfolio includes toys, games, television programming, motion pictures, and a licensing program. The company's popular brands such as Transformers, Nerf, and Magic: The Gathering have a significant market presence. Hasbro's strategic acquisitions like Entertainment One and partnerships like Dungeons & Dragons Beyond have further strengthened its multichannel presence.
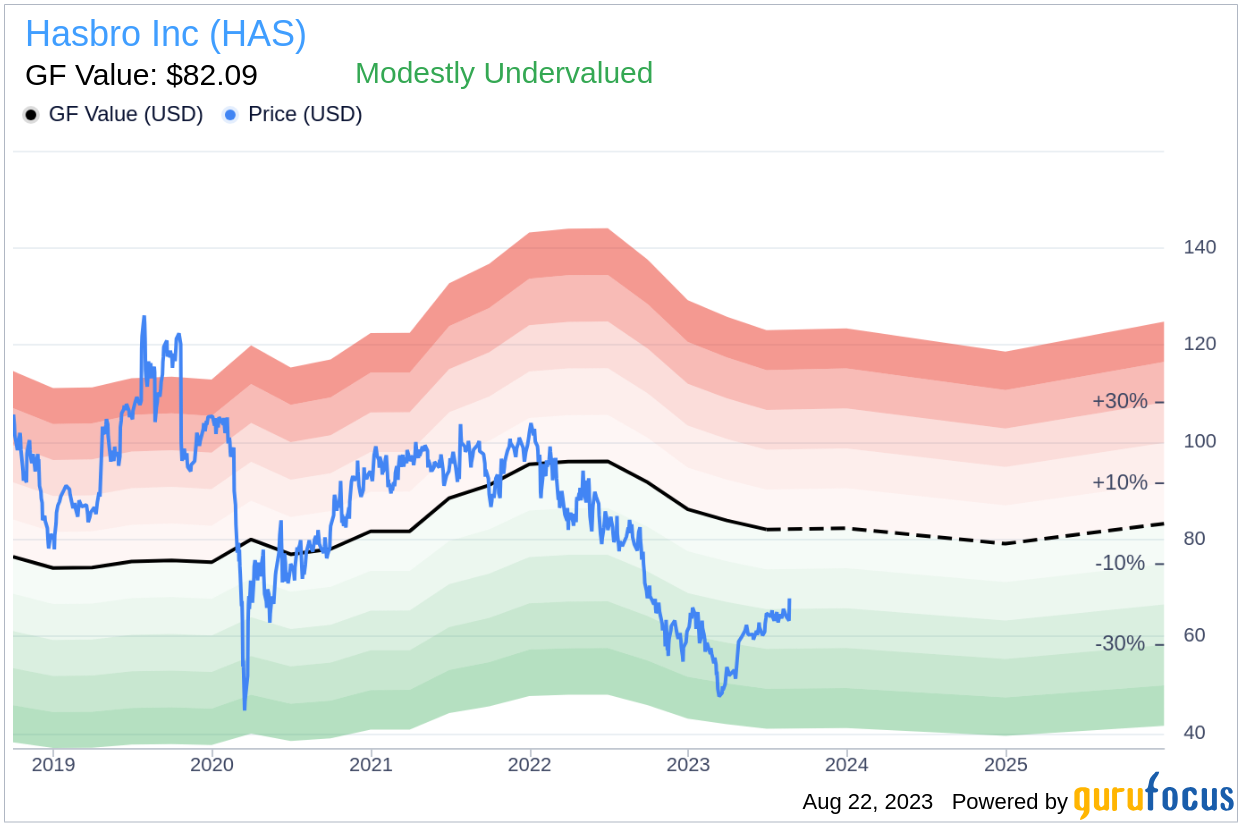
With a current stock price of $67.81 and a market cap of $9.40 billion, Hasbro (HAS, Financial) seems to be modestly undervalued compared to its GF Value of $82.09.
Understanding the GF Value
The GF Value is a proprietary measure that estimates the fair trading value of a stock. This valuation is based on historical trading multiples, a GuruFocus adjustment factor, and future business performance estimates. If a stock's price significantly deviates from the GF Value Line, it indicates that the stock is either overvalued or undervalued, which can impact its future returns.
For Hasbro, the GF Value suggests that the stock is modestly undervalued. This indicates that the long-term return of its stock is likely to be higher than its business growth.
Link: These companies may deliver higher future returns at reduced risk.
Financial Strength Analysis
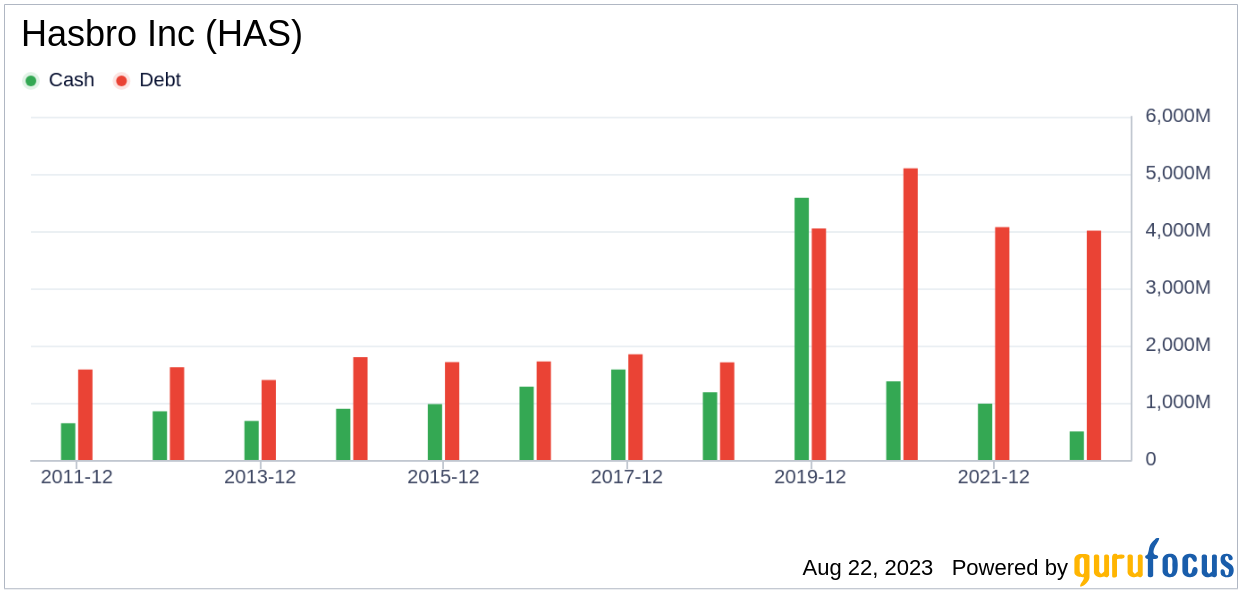
Understanding a company's financial strength is crucial to mitigate the risk of permanent capital loss. Key indicators of financial strength include the cash-to-debt ratio and interest coverage. Hasbro's cash-to-debt ratio of 0.05 ranks lower than 88.05% of 820 companies in the Travel & Leisure industry, indicating poor financial strength.
Profitability and Growth
Investing in profitable companies, especially those with consistent long-term profitability and high-profit margins, is generally less risky. Hasbro has been profitable 10 times over the past 10 years. Despite a Loss Per Share of $1.85 in the past twelve months, its operating margin of 2.72% indicates strong profitability.
Growth is a key factor in a company's valuation. Hasbro's 3-year average annual revenue growth rate is 4.7%, which ranks better than 65.89% of 768 companies in the Travel & Leisure industry. The 3-year average EBITDA growth rate is 5.5%, ranking better than 52.45% of companies in the same industry.
ROIC vs WACC
A comparison of a company's return on invested capital (ROIC) and its weighted average cost of capital (WACC) can provide insights into its profitability. Hasbro's ROIC of 2.21 over the past 12 months is lower than its WACC of 6, which could be a cause for concern.

Conclusion
Despite some financial concerns, Hasbro (HAS, Financial) appears to be modestly undervalued. The company has shown strong profitability and decent growth, ranking better than 52.45% of companies in the Travel & Leisure industry. For more information on Hasbro stock, check out its 30-Year Financials here.
For a list of high-quality companies that may deliver above-average returns, visit GuruFocus High Quality Low Capex Screener.