
Advertisement
Advertisement
Gold’s Tug of War: Key Support and Resistance Levels in Focus
By:
Gold's price action is at a crossroads, with an eye on both downside support levels and upside breakout opportunities, particularly on the weekly chart.

In this article:
Gold Forecast Video for 08.09.23 by Bruce Powers
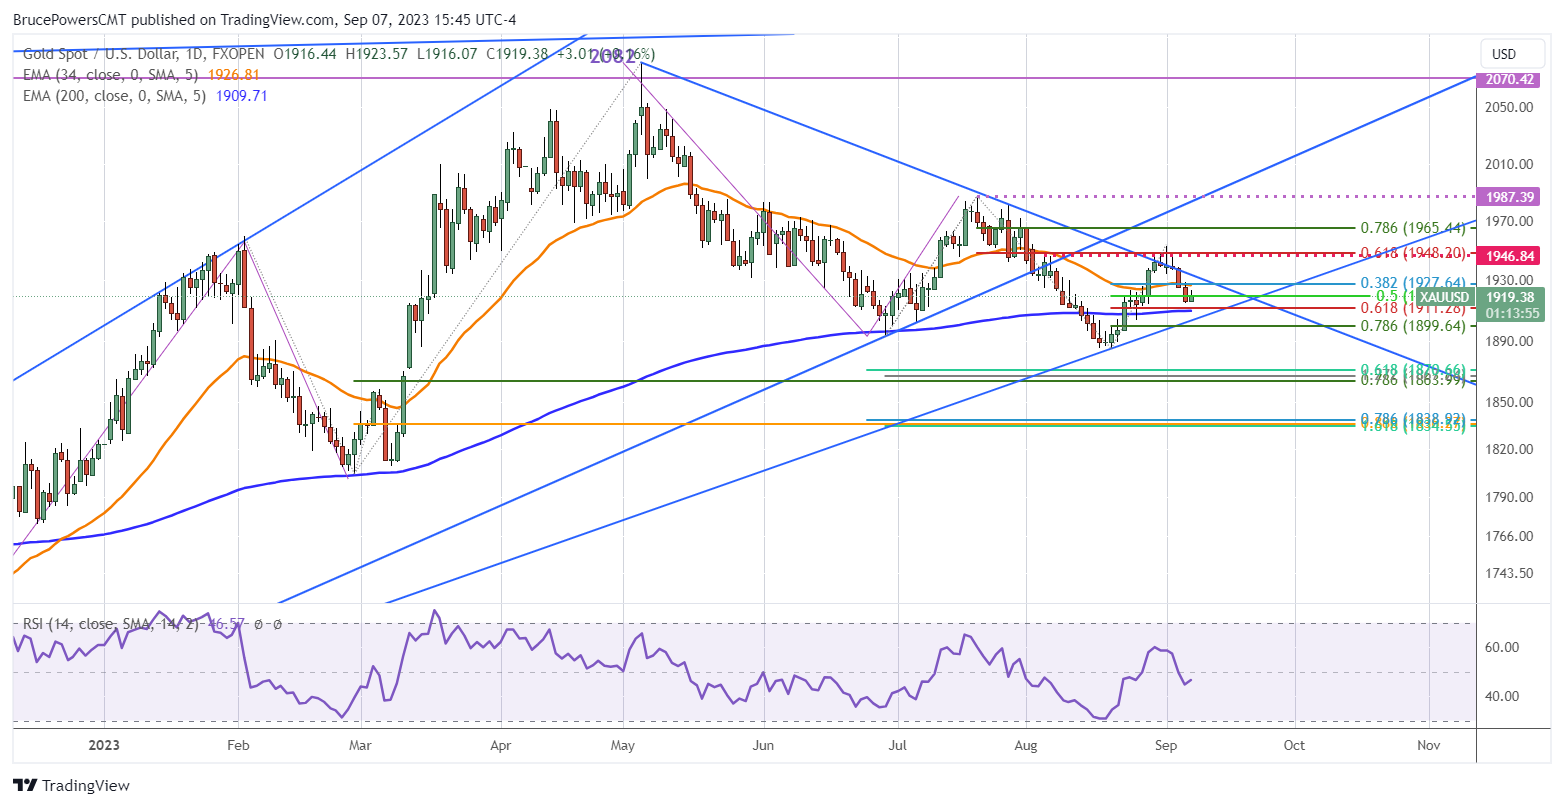
Gold stalls its descent to trade inside day as it consolidates in the lower half of Wednesday’s price range. Today’s low is 1,916. A decisive drop below today’s low triggers a bearish inside day down signal, which is further confirmed on a drop below Wednesday’s low of 1,915. Following such a move gold would next be targeting the 61.8% Fibonacci retracement around 1,911, along with the 200-Day EMA at 1,910. Also, keep an eye on the lower uptrend line.
Deeper Retracement Looks Likely
Nevertheless, it does look like gold has a good chance of a deeper retracement. Its 34-Day EMA has started to angle down, today’s trading occurred in the lower half of yesterday’s price range, and it is likely to close at resistance of the 50% retracement, which is at 1,919.5.
Notice that gold is approaching the intersection of two trendlines, one heading up and one down. It only has around seven more days to trade before it breaks one of the lines. Once a line is clearly busted, volatility should pick up. If the lower line is busted to the downside prior to an upside breakout, first watch for support around the 78.6% Fibonacci retracement around 1,900. If it continues to weaken from there, the recent swing low of 1,885 followed by a price zone starting around 1,871 would be the next lower target.
Upside Potential
On the upside, a daily close above the internal downtrend line (approximately 1,933 as of tomorrow) will provide an early bullish signal. Generally, trendlines by themselves are not very reliable for a signal. However, this would give us an indication that demand is picking up and buyers are starting to get more aggressive. A daily close above Wednesday’s high of 1,929 gives a more specific bullish signal that will need additional confirmation to improve its reliability as a sign of strength that can further improve.
Regardless, a decisive breakout above this week’s high of 1,946 provides a more reliable signal since it is based on the weekly chart. This week is an inside week. A subsequent upside breakout triggers an inside week breakout.
For a look at all of today’s economic events, check out our economic calendar.
About the Author
Bruce Powersauthor
Bruce boasts over 20 years in financial markets, holding senior roles such as Head of Trading Strategy at Relentless 13 Capital and Corporate Advisor at Chronos Futures. A CMT® charter holder and MBA in Finance, he's a renowned analyst and media figure, appearing on 150+ TV business shows.
Did you find this article useful?
Latest news and analysis


Advertisement