![]() Elliott Wave Forecast Team
Elliott Wave Forecast Team
ElliottWave-Forecast.com
Royal Caribbean Cruises Ltd (NYSE: RCL), a leading player in the global cruise industry, has weathered the challenges of the past year and is now poised for continued growth and success. As the world emerges from the pandemic and travel restrictions gradually ease, Royal Caribbean Cruises is well-positioned to capitalize on the pent-up demand for travel and the resurging interest in cruise vacations. In this article, we delve into the Elliott Wave analysis of RCL, uncovering bullish structure that could shape the company’s future and captivate the attention of both long-term investors and short-term traders.
Since the 2020 market crash, Royal Caribbean Cruises Ltd (NYSE: RCL) has demonstrated a remarkable recovery, embarking on a strong bullish journey. The initial wave (I) saw an impressive 400% rally from the lows, showcasing the company’s resilience. Following this ascent, wave (II) brought about a necessary correction, with a notable retracement of 67%. This correction found support in July of the previous year, remaining above the $19 low.
The subsequent phase has seen RCL forging ahead with an impulsive structure, experiencing significant gains of around 200%. As the stock continues its upward trajectory, it is poised to approach a critical milestone – a potential breakthrough above the 2021 peak. This breakthrough would mark the establishment of a higher high sequence within the weekly cycle, propelling RCL towards an exciting upside potential in the range of $111 to $129.
RCL weekly Elliott Wave chart
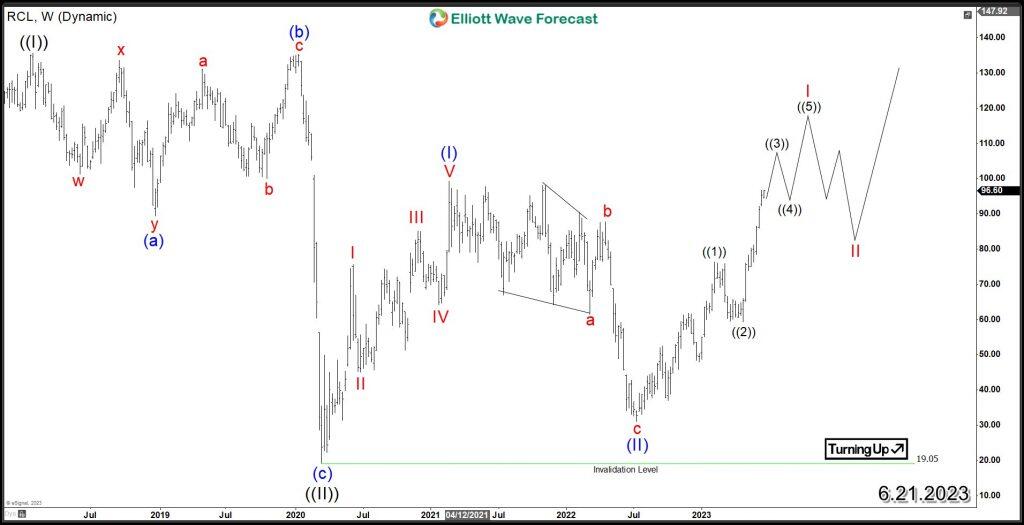
The upward move is proposed to be wave I of (III), potentially setting the stage for further upside. A subsequent daily correction in wave II may present a promising investing opportunity in the future. However, if RCL manages to surpass its previous all-time high, specifically the 2018 peak, it could trigger an acceleration in price towards the 160 level. This scenario suggests that wave III may already be underway within a nest formation, eliminating the need for a larger correction.
RCL is poised for potential extension to the upside in both scenarios, as it currently resides in the robust wave ((III)) of the grand super cycle. This wave is typically characterized by strong momentum and extensions, observed across both weekly and daily cycles. To fully capitalize on this opportunity, it is crucial to identify the early stages of the cycle and establish a long-term position in anticipation of the upward move. By doing so, investors can position themselves advantageously to maximize their gains.
In conclusion, Royal Caribbean Cruises Ltd (NYSE: RCL) presents a compelling Elliott Wave structure that strongly supports a continued upward trajectory in the company’s stock. With the weekly cycle indicating further upside potential, investors can remain optimistic about the prospects of RCL. While the market may experience occasional corrective pullbacks, these dips provide valuable buying opportunities for investors looking to capitalize on the long-term growth potential of Royal Caribbean Cruises. By staying attuned to the evolving market dynamics and leveraging the insights provided by Elliott Wave analysis, investors can navigate the fluctuations and position themselves strategically for success in their RCL investment journey.
FURTHER DISCLOSURES AND DISCLAIMER CONCERNING RISK, RESPONSIBILITY AND LIABILITY Trading in the Foreign Exchange market is a challenging opportunity where above average returns are available for educated and experienced investors who are willing to take above average risk. However, before deciding to participate in Foreign Exchange (FX) trading, you should carefully consider your investment objectives, level of xperience and risk appetite. Do not invest or trade capital you cannot afford to lose. EME PROCESSING AND CONSULTING, LLC, THEIR REPRESENTATIVES, AND ANYONE WORKING FOR OR WITHIN WWW.ELLIOTTWAVE- FORECAST.COM is not responsible for any loss from any form of distributed advice, signal, analysis, or content. Again, we fully DISCLOSE to the Subscriber base that the Service as a whole, the individual Parties, Representatives, or owners shall not be liable to any and all Subscribers for any losses or damages as a result of any action taken by the Subscriber from any trade idea or signal posted on the website(s) distributed through any form of social-media, email, the website, and/or any other electronic, written, verbal, or future form of communication . All analysis, trading signals, trading recommendations, all charts, communicated interpretations of the wave counts, and all content from any media form produced by www.Elliottwave-forecast.com and/or the Representatives are solely the opinions and best efforts of the respective author(s). In general Forex instruments are highly leveraged, and traders can lose some or all of their initial margin funds. All content provided by www.Elliottwave-forecast.com is expressed in good faith and is intended to help Subscribers succeed in the marketplace, but it is never guaranteed. There is no “holy grail” to trading or forecasting the market and we are wrong sometimes like everyone else. Please understand and accept the risk involved when making any trading and/or investment decision. UNDERSTAND that all the content we provide is protected through copyright of EME PROCESSING AND CONSULTING, LLC. It is illegal to disseminate in any form of communication any part or all of our proprietary information without specific authorization. UNDERSTAND that you also agree to not allow persons that are not PAID SUBSCRIBERS to view any of the content not released publicly. IF YOU ARE FOUND TO BE IN VIOLATION OF THESE RESTRICTIONS you or your firm (as the Subscriber) will be charged fully with no discount for one year subscription to our Premium Plus Plan at $1,799.88 for EACH person or firm who received any of our content illegally through the respected intermediary’s (Subscriber in violation of terms) channel(s) of communication.
Recommended content
Editors’ Picks
EUR/USD retreats toward 1.0850 on modest USD recovery

EUR/USD stays under modest bearish pressure and trades in negative territory at around 1.0850 after closing modestly lower on Thursday. In the absence of macroeconomic data releases, investors will continue to pay close attention to comments from Federal Reserve officials.
GBP/USD holds above 1.2650 following earlier decline

GBP/USD edges higher after falling to a daily low below 1.2650 in the European session on Friday. The US Dollar holds its ground following the selloff seen after April inflation data and makes it difficult for the pair to extend its rebound. Fed policymakers are scheduled to speak later in the day.
Gold climbs to multi-week highs above $2,400

Gold gathered bullish momentum and touched its highest level in nearly a month above $2,400. Although the benchmark 10-year US yield holds steady at around 4.4%, the cautious market stance supports XAU/USD heading into the weekend.
Chainlink social dominance hits six-month peak as LINK extends gains
-637336005550289133_XtraSmall.jpg)
Chainlink (LINK) social dominance increased sharply on Friday, exceeding levels seen in the past six months, along with the token’s price rally that started on Wednesday.
Week ahead: Flash PMIs, UK and Japan CPIs in focus – RBNZ to hold rates

After cool US CPI, attention shifts to UK and Japanese inflation. Flash PMIs will be watched too amid signs of a rebound in Europe. Fed to stay in the spotlight as plethora of speakers, minutes on tap.