

Ingersoll Rand Inc (IR, Financial) has recently shown a modest daily gain of 0.11%, yet over the last three months, it has experienced a slight decline of 3.72%. With an Earnings Per Share (EPS) of 1.87, investors may question whether the stock is fairly valued. To address this, we delve into a valuation analysis that promises to provide an in-depth look at Ingersoll Rand's market standing. Read on to uncover the intrinsic value of Ingersoll Rand and determine if its current market price reflects its true worth.
Company Introduction
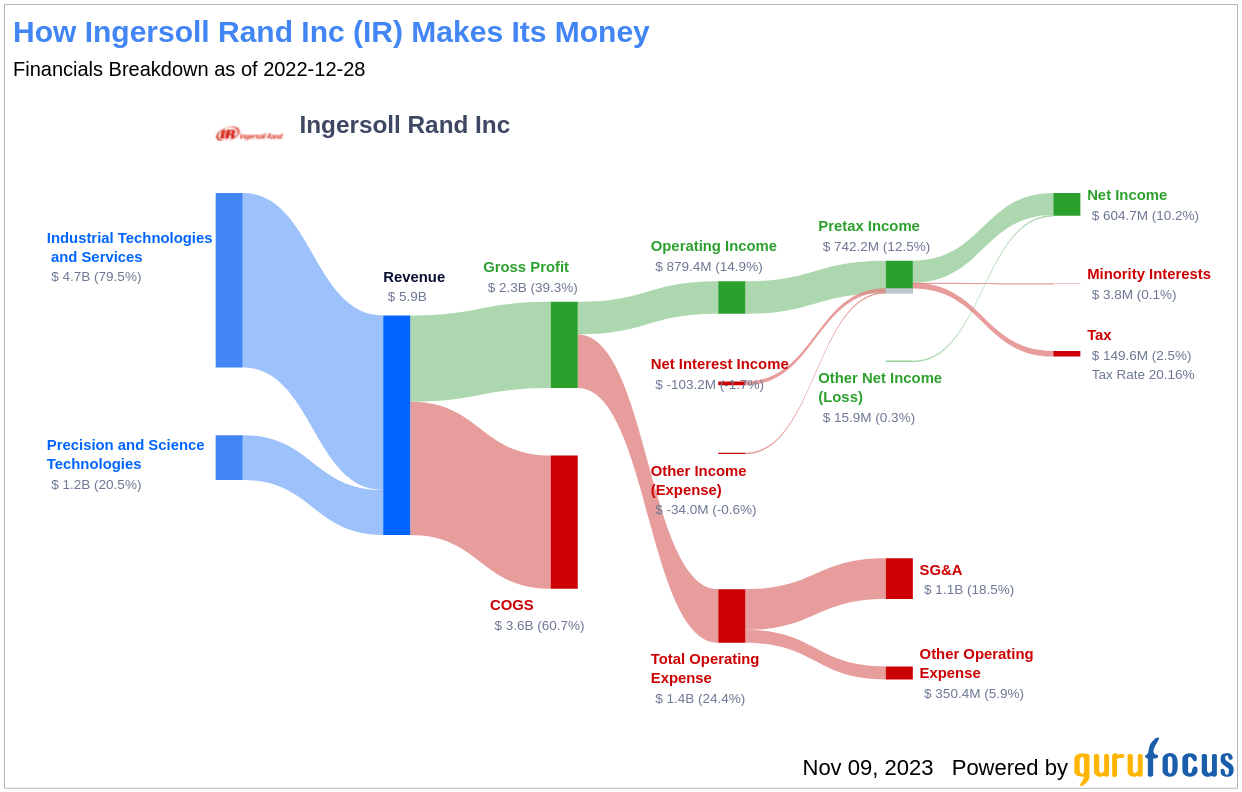
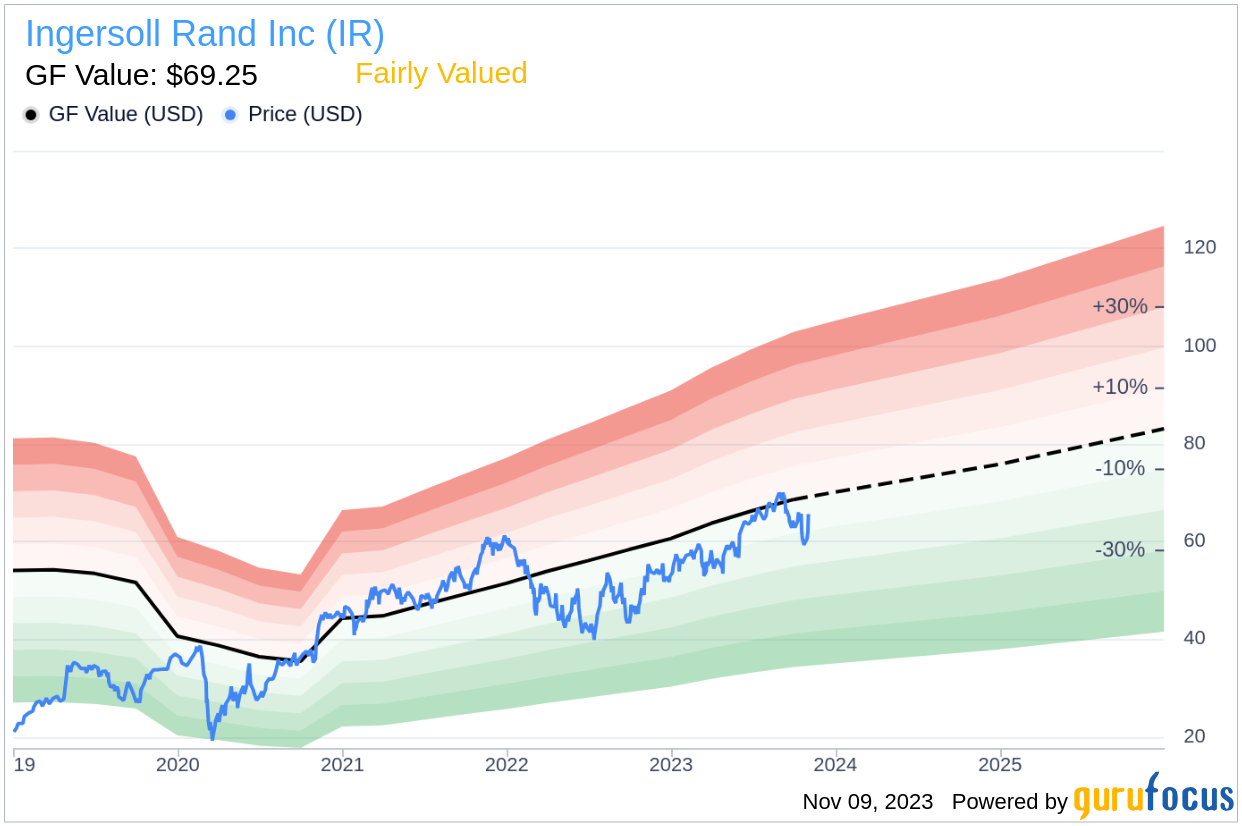
Ingersoll Rand Inc (IR, Financial), a product of the merger between Gardner Denver and Ingersoll Rand's industrial segment, is a powerhouse in the industrial, medical, and energy sectors. With a diverse product range that includes compression, blower and vacuum, and fluid management technologies, the company generated approximately $5.9 billion in revenue in 2022. Comparing the current stock price of $66.05 to the GF Value of $69.25, an estimation of fair value, sets the stage for a nuanced valuation analysis that merges financial insights with key company information.
Summarize GF Value
The GF Value is a proprietary metric that represents the intrinsic value of a stock, incorporating historical trading multiples, a GuruFocus adjustment factor based on past performance and growth, and future business estimates. This value serves as a benchmark, indicating whether a stock is overvalued or undervalued in relation to its fair trading value. Ingersoll Rand (IR, Financial), with a market cap of $26.70 billion, appears to be fairly valued at its current price. This suggests that the long-term return of its stock is likely to align with the company's business growth rate.
Link: These companies may deliver higher future returns at reduced risk.
Financial Strength
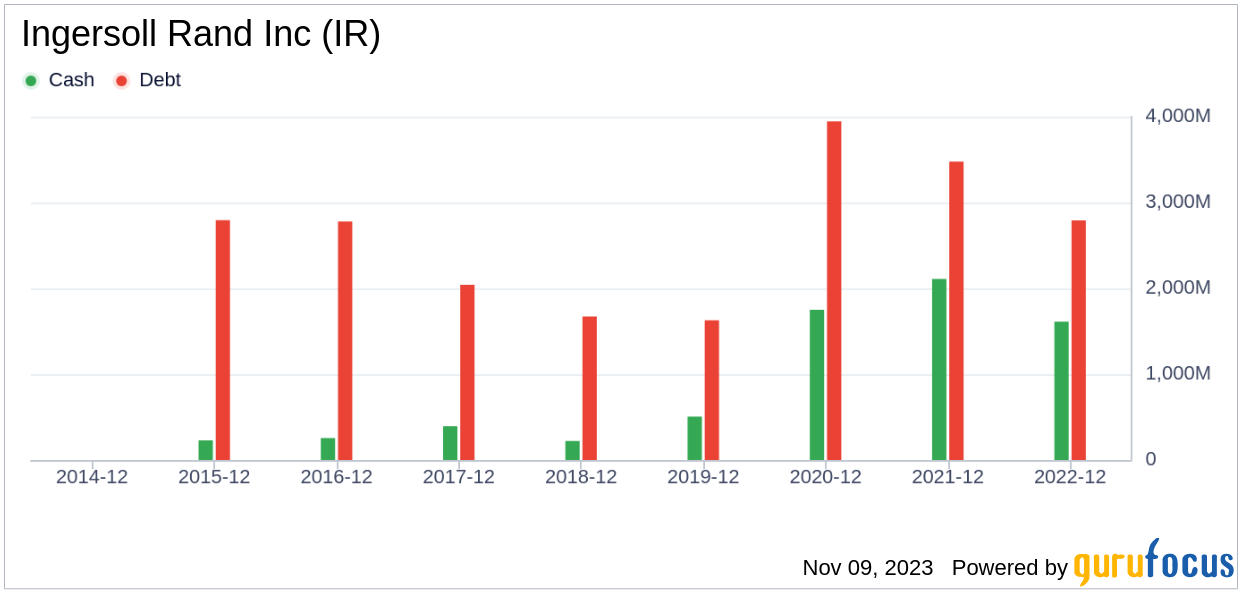
Investing in companies with robust financial strength is crucial to minimize the risk of capital loss. Ingersoll Rand's financial strength, with a cash-to-debt ratio of 0.43, is fair, ranking better than 29.66% of its industry peers. This indicates a solid foundation for the company's financial stability, despite being less impressive than some competitors.
Profitability and Growth
Consistent profitability is a sign of a less risky investment, and Ingersoll Rand, with a 5-year profitable track record, boasts a strong operating margin of 17.63%. This ranks higher than 87.84% of companies in the Industrial Products industry, reflecting a competitive edge in profitability. Furthermore, Ingersoll Rand's growth metrics, including a 3-year average revenue growth rate that outperforms 70.43% of its industry peers, underline the company's potential for value creation.
ROIC vs WACC
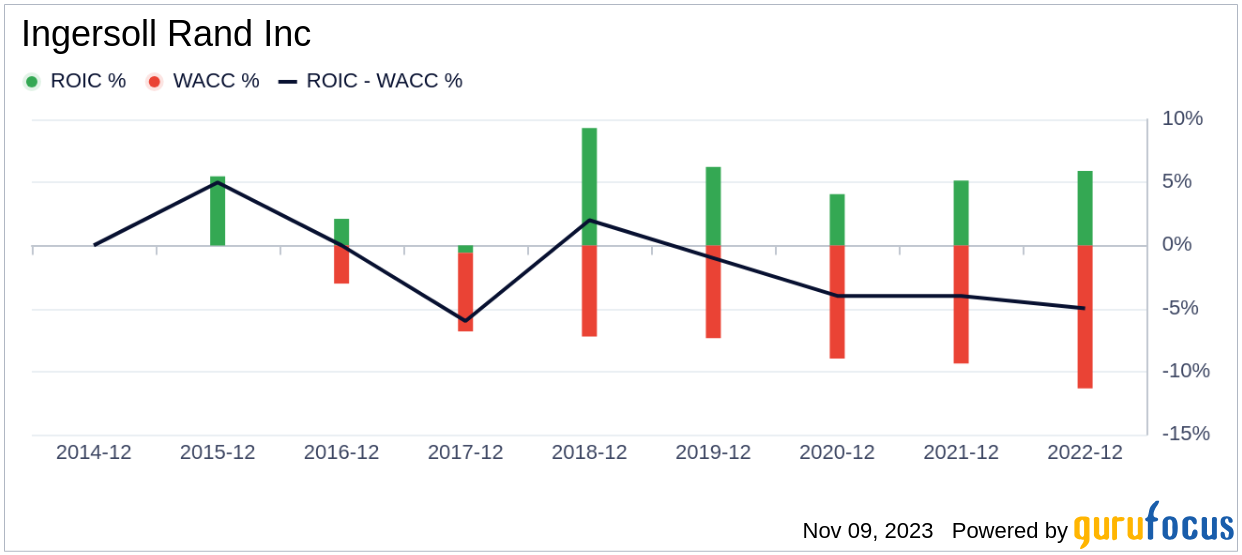
Comparing a company's Return on Invested Capital (ROIC) to its Weighted Average Cost of Capital (WACC) provides insight into its profitability relative to the cost of financing its operations. Ingersoll Rand's ROIC of 7.46 is currently lower than its WACC of 12.35, suggesting that the company needs to improve its capital efficiency to enhance shareholder value.
Conclusion
In conclusion, Ingersoll Rand (IR, Financial) is fairly valued, with a solid financial condition and fair profitability. The company's growth is commendable, ranking well within the Industrial Products industry. Investors interested in a deeper understanding of Ingersoll Rand's financials can explore its 30-Year Financials here.
Discover High-Quality Investment Opportunities
To uncover high-quality companies that may deliver above-average returns, consider using the GuruFocus High Quality Low Capex Screener.
This article, generated by GuruFocus, is designed to provide general insights and is not tailored financial advice. Our commentary is rooted in historical data and analyst projections, utilizing an impartial methodology, and is not intended to serve as specific investment guidance. It does not formulate a recommendation to purchase or divest any stock and does not consider individual investment objectives or financial circumstances. Our objective is to deliver long-term, fundamental data-driven analysis. Be aware that our analysis might not incorporate the most recent, price-sensitive company announcements or qualitative information. GuruFocus holds no position in the stocks mentioned herein.