
Advertisement
Advertisement
Gold’s Rising Momentum: ABCD Pattern Targets Higher Prices
By:
Gold's bullish momentum strengthens as it eyes higher prices, supported by Fibonacci retracements and trendline breakthroughs.

In this article:
Gold Forecast Video for 12.07.23 by Bruce Powers
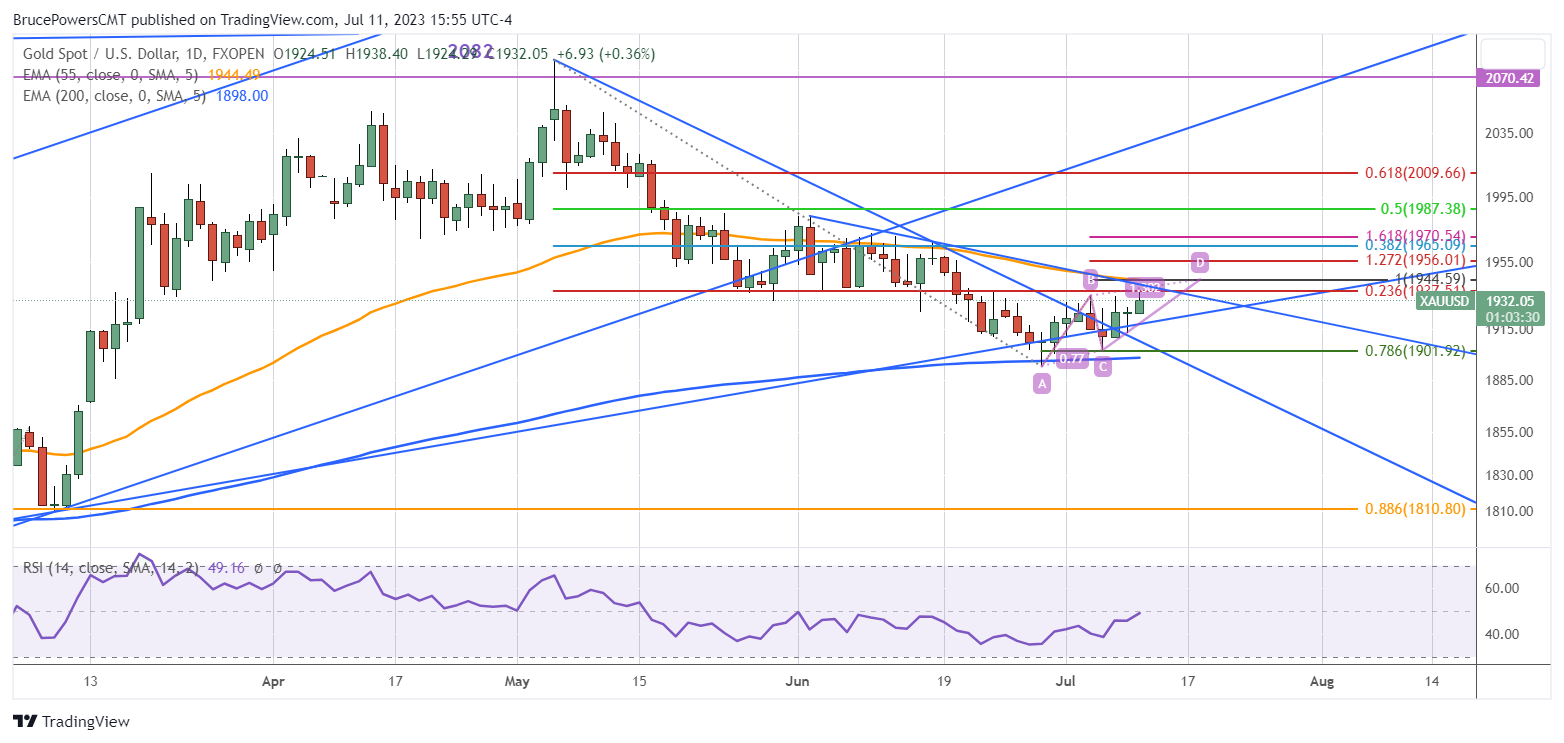
Gold reached a high of 1,938 today before encountering resistance that turned the precious metal back down. That high completed a 23.6% Fibonacci retracement. The initial advance triggered a bullish trend continuation on a move above the prior trend high and weekly high of 1,935. At the time of this writing gold is set to close below last week’s high, which would not be a strong close. Nevertheless, gold looks to be ready to complete a rising ABCD pattern that targets 1,945 initially. The area of that target is also marked by the 34-Day EMA, currently around 1,944.
Rise Continues or Another Test of Lows?
The concern now is whether gold will continue to rally once it completes the ABCD pattern, or does it head to another test of the lows? We will be watching. However, gold has had a successful test of support of the 200-Day EMA (blue) twice and it is back above an internal uptrend line. In addition, it has triggered a weekly breakout, which is the beginning of a weekly trend. Also, today’s setup, that did trigger, was of an inside day that takes the form of a bullish momentum doji hammer. It is supportive of gold reaching the ABCD target, at a minimum.
Daily Close Above 1,935 Confirms Strength
A daily close above last week’s high is still needed to confirm strength. Once that happens the chance of the correction being completed has increased. Subsequently, a daily close above the 34-Day EMA will further confirm. Once price rises away from the 34-Day line, gold should be on its way higher.
1,965 Completes Minimum Fibonacci Retracement of 38.2%
For higher targets, let us first consider the minimum Fibonacci retracement 38.2%. It is at 1,965 and has a great chance of eventually being hit if not exceeded. The most recent swing high in the downtrend is part of the trend structure of lower swing highs. A daily close above it will provide the more significant indication that gold has reversed higher. Overall, given the bullish bigger picture in gold it is anticipated to eventually test and exceed recent highs.
For a look at all of today’s economic events, check out our economic calendar.
About the Author
Bruce Powersauthor
Bruce boasts over 20 years in financial markets, holding senior roles such as Head of Trading Strategy at Relentless 13 Capital and Corporate Advisor at Chronos Futures. A CMT® charter holder and MBA in Finance, he's a renowned analyst and media figure, appearing on 150+ TV business shows.
Did you find this article useful?
Latest news and analysis


Advertisement