
Gold, Silver, Trendlines, Symmetrical Triangle – Technical Update:
- Gold prices remain tilted lower due to key trendline
- On the other hand, Silver remains in a neutral state
- What are key levels to watch for XAU and XAG?

XAU/USD Analysis
Gold prices appear to be increasingly struggling to break above the key falling trendline from May on the daily chart below. Last week, XAU/USD climbed to the former rising trendline from October after breaking below it, failing to push back above the line. This created a key juncture of resistance that combined both trendlines.
Since then, prices have aimed slightly lower, reinforcing the falling trendline. From here, immediate support is the 38.2% Fibonacci retracement level of 1903.46, followed by the August swing lower at 1884.89. Breaking above the trendline could open the door to a broader reversal, exposing the 23.6% level at 1971.63.

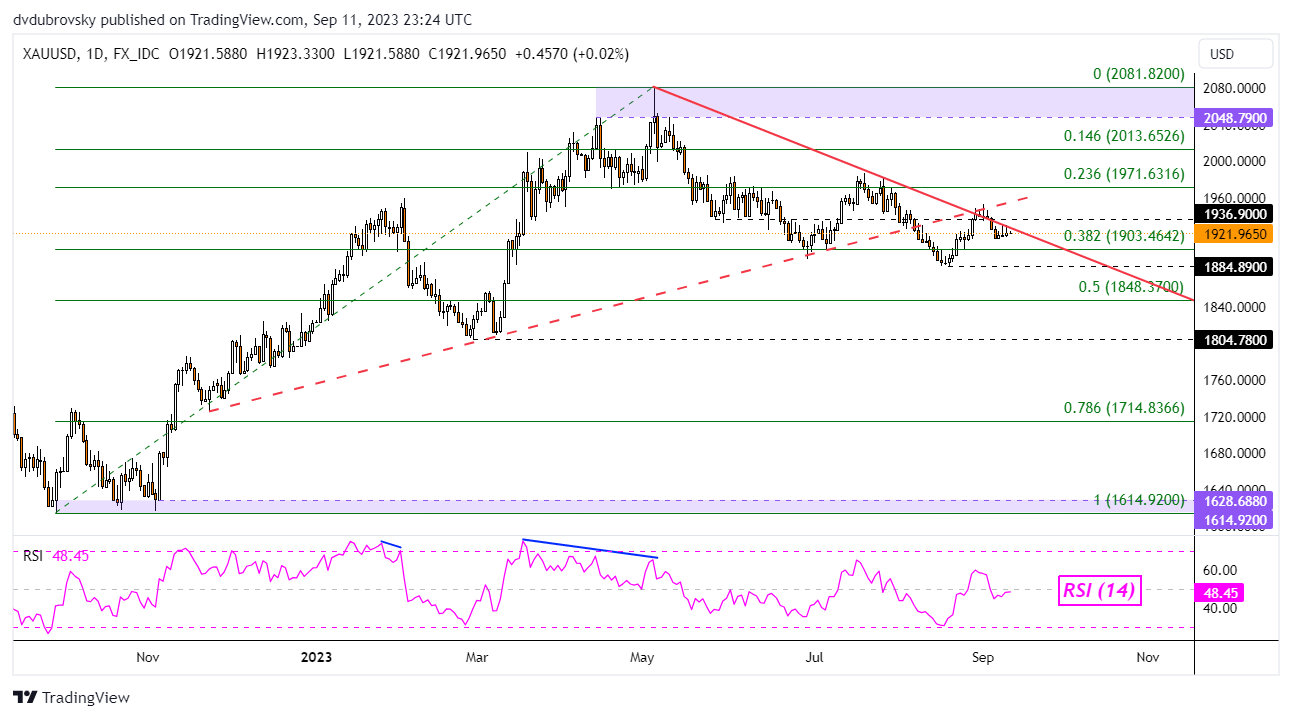
Chart Created in TradingView
XAG/USD Analysis
Taking a look at silver, the broader technical landscape remains neutral. This is because XAG/USD is consolidating between a rising zone of support from August 2022, and a falling range of resistance from earlier this year. Lately, this has been creating a Symmetrical Triangle chart formation. Then direction of the breakout could be key for the coming trend.
Currently, silver is hovering around the midpoint of the Fibonacci retracement level of 23.02, breaking lower exposes the rising range of support and the 61.8% point at 22.29. On the flip side, immediate resistance is the 38.2% level at 23.75. Just beyond that the falling range of resistance will kick in. With that in mind, the silver outlook remains neutral.
| Change in | Longs | Shorts | OI |
| Daily | 4% | 0% | 3% |
| Weekly | 23% | -18% | 10% |
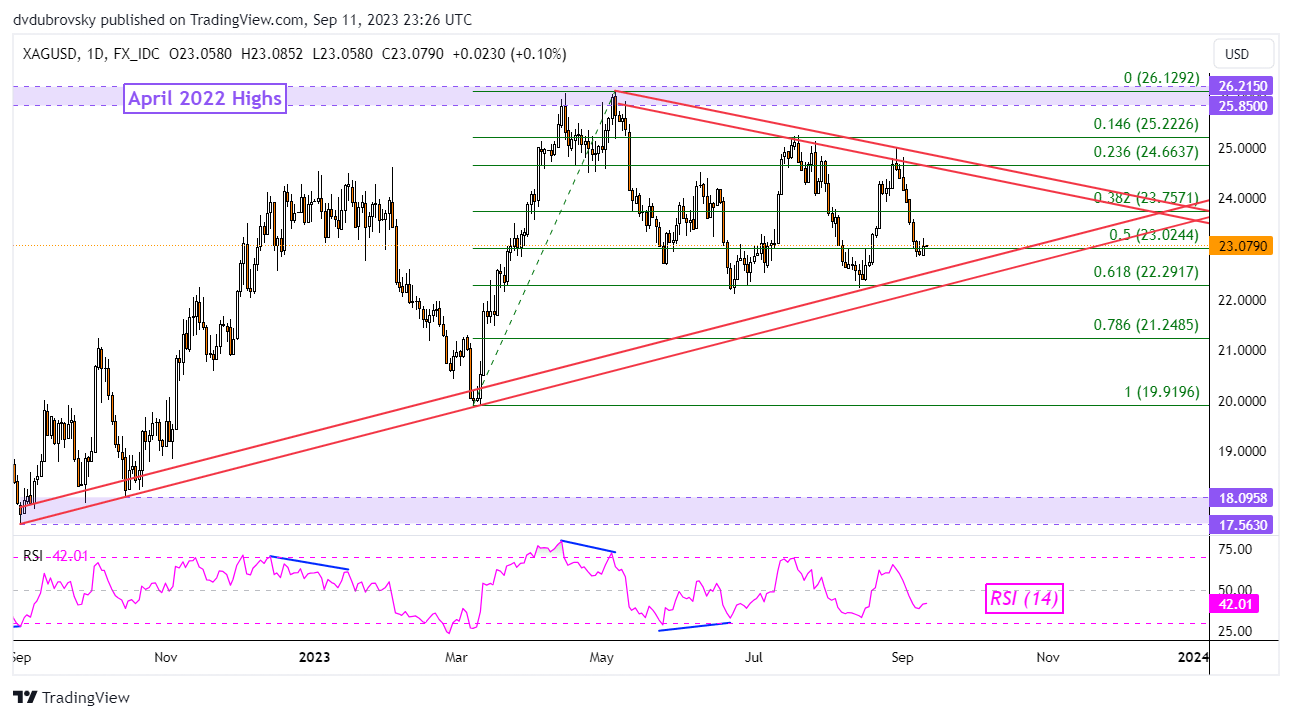
Chart Created in TradingView
--- Written by Daniel Dubrovsky, Strategist for DailyFX.com