
Advertisement
Advertisement
BTC Eyes $29,000 to Retarget $30,000 on Easing Recession Jitters
By:
It is a quiet day ahead for BTC. A lack of US economic indicators leaves the SEC v Ripple case and Binance and Coinbase-related news to influence.

In this article:
Key Insights:
- On Sunday, BTC joined the broader crypto market in the red, falling by 1.47% to end the day at $28,484.
- A quiet Sunday left regulatory jitters to influence as investors consider the US CPI Report on Wednesday.
- The technical indicators were bearish, signaling a return to sub-$28,000.
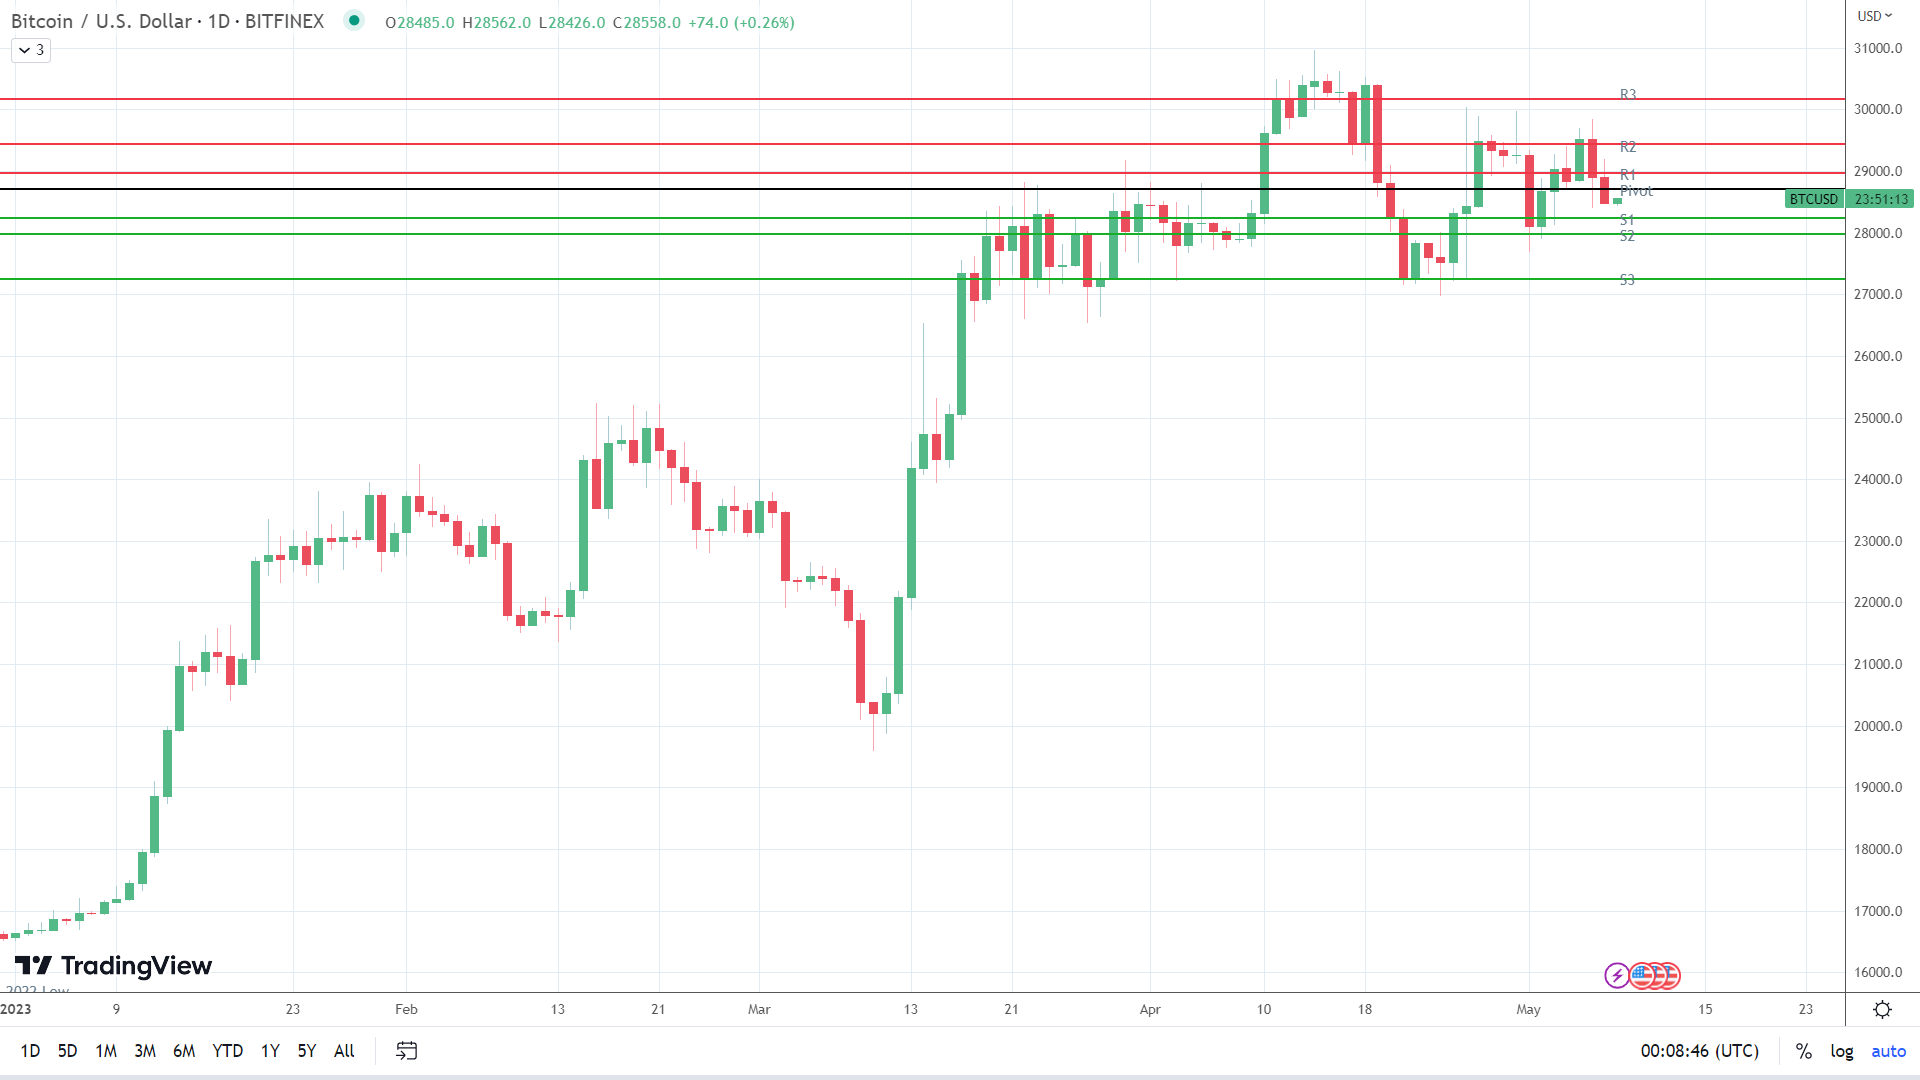
On Sunday, bitcoin (BTC) fell by 1.47%. Following a 2.09% loss on Saturday, BTC ended the week down by 2.63% to $28,484. Despite the bearish session, BTC revisited the $29,000 handle before hitting reverse.
A bullish start to the day saw BTC strike an early morning high of $29,188. Falling short of the First Major Resistance Level (R1) at $29,702, BTC fell to a final-hour low of $28,458. However, steering clear of the First Major Support Level (S1) at $28,260, BTC wrapped up the day at $28,484.
NASDAQ Mini Delivers a Final Hour BTC Pullback
It was a quiet Sunday. There were no external market forces to impact, leaving investors to consider the macroeconomic environment, the crypto regulatory landscape, and the Fed’s monetary policy outlook.
While the US Jobs Report eased recessionary jitters, US indicators revealed a fatigued US economy plagued by Fed monetary policy. While a brewing banking crisis could support BTC and the broader crypto market, US lawmaker scrutiny, and regulatory activity remain headwinds.
A favorable Court ruling in the ongoing SEC v Ripple case would bring about hope of a change in the crypto regulatory landscape and limit the powers of the SEC to regulate by enforcement. However, a lack of Court rulings continues to test buyer appetite.
In the final hour, the NASDAQ mini added to the bearish mood. The NASDAQ mini reversed early gains, falling by 7.25 points this morning.
The Day Ahead
It is a quiet day ahead. There are no US economic indicators to draw investor interest this afternoon. The lack of economic indicators will leave corporate earnings and Fed chatter to influence.
However, regulatory activity and US lawmakers will continue to impact market sentiment. Investors should track SEC v Ripple case updates, with a Court ruling likely to have a material impact. Binance and Coinbase (COIN)-related news would also move the dial. Both are currently under the US Government spotlight.
Bitcoin (BTC) Price Action
This morning, BTC was up 0.26% to $28,886. A mixed start to the day saw BTC fall to an early low of $28,426 before rising to a high of $28,562.
Technical Indicators
Resistance & Support Levels
| R1 – $ | 28,962 | S1 – $ | 28,232 |
| R2 – $ | 29,440 | S2 – $ | 27,980 |
| R3 – $ | 30,170 | S3 – $ | 27,250 |
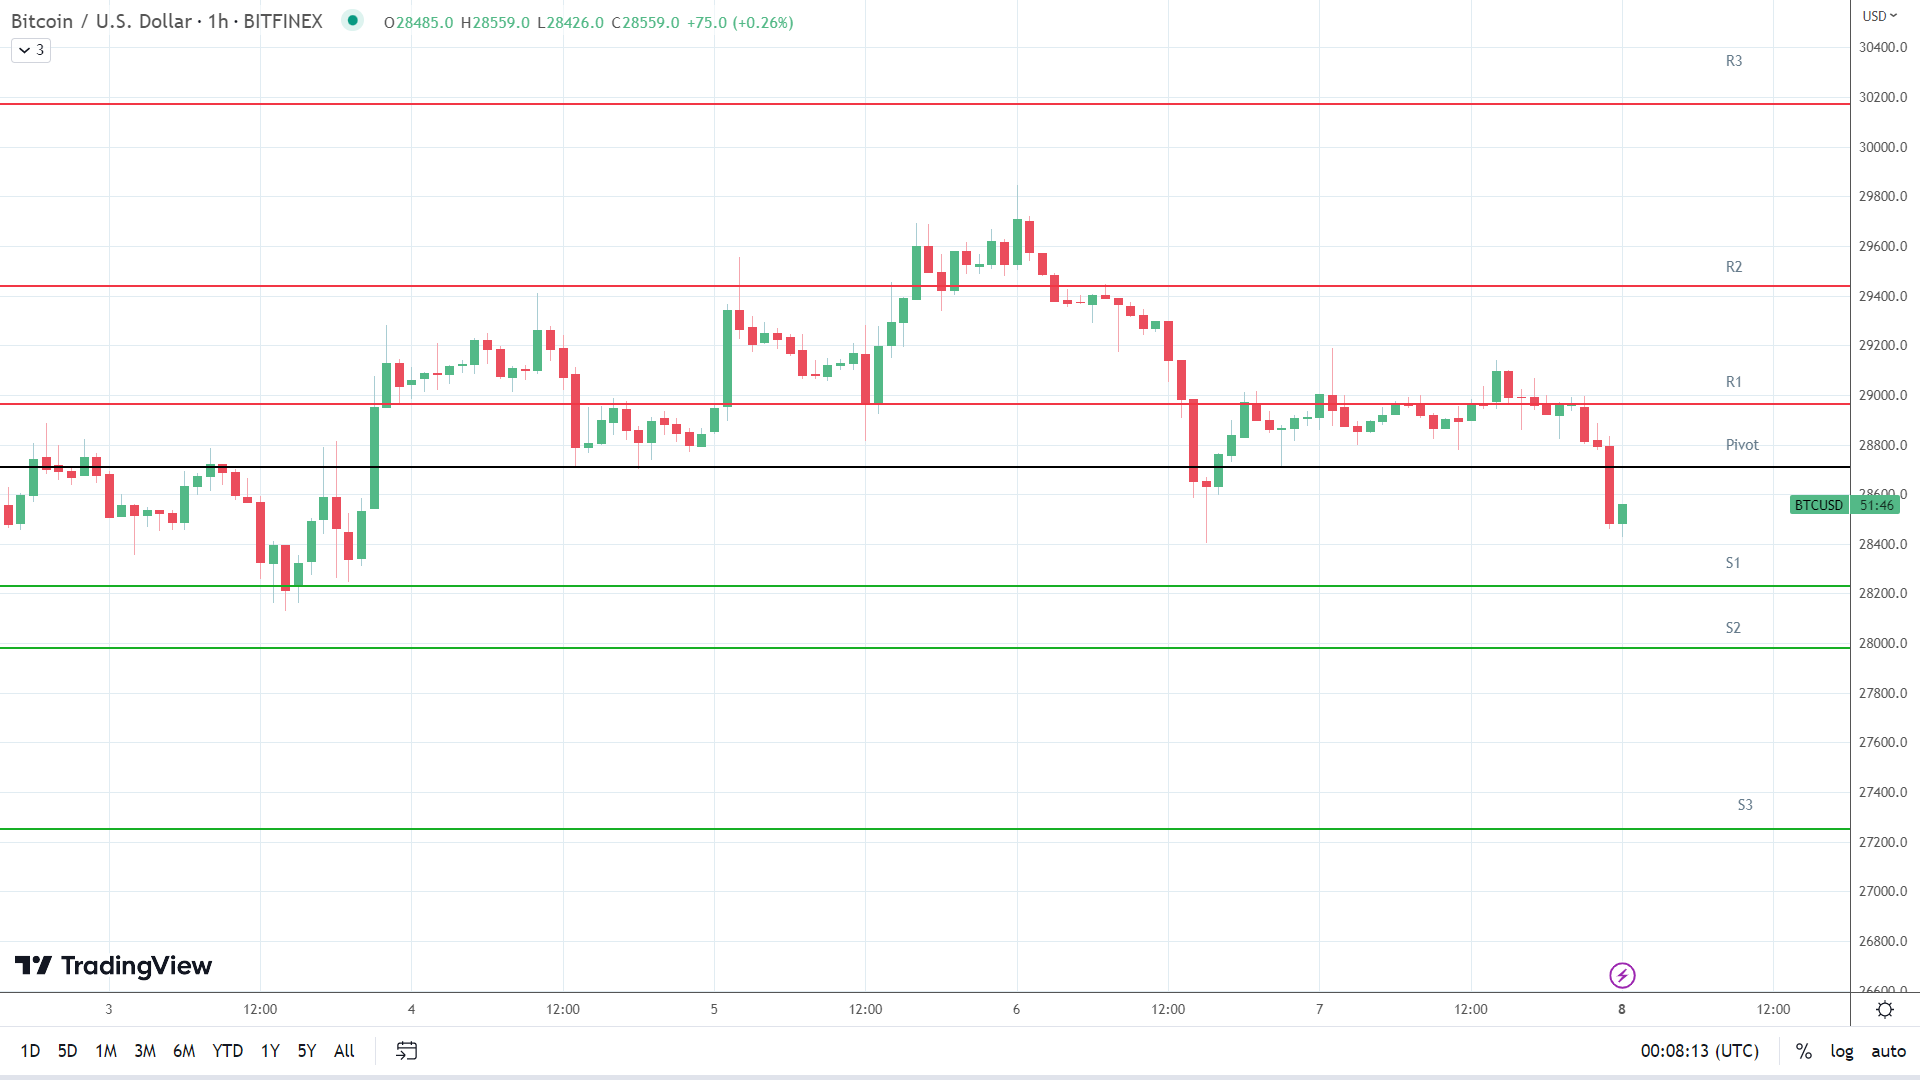
BTC needs to avoid the $28,710 pivot to target the First Major Resistance Level (R1) at $28,962 and the Sunday high of $29,188. A return to $29,000 would signal an extended bullish session. The crypto news wires should be crypto-friendly to support an extended rally.
In the event of an extended rally, BTC would likely test the Second Major Resistance Level (R2) at $29,440 and resistance at $29,500. The Third Major Resistance Level (R3) sits at $30,170.
A fall through the pivot would bring the First Major Support Level (S1) at $28,232 into play. However, barring a crypto event-fueled sell-off, BTC should avoid sub-$28,000 and the Second Major Support Level (S2) at $27,980. The Third Major Support Level (S3) sits at $27,250.
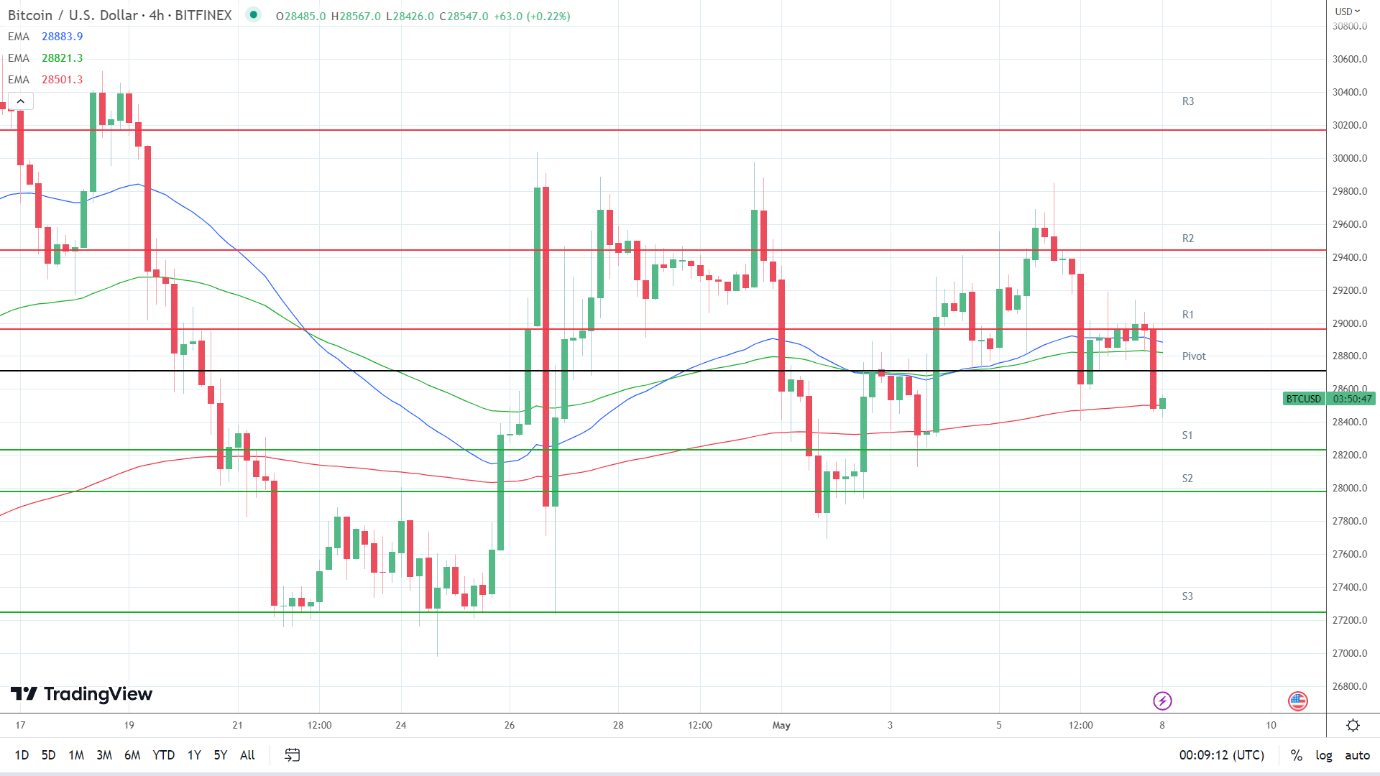
Looking at the EMAs and the 4-hourly candlestick chart (below), it was bearish signals. BTC sat above the 200-day EMA ($28,501). The 50-day EMA closed in on the 100-day EMA, with the 100-day EMA narrowing to the 200-day EMA, sending bearish signals.
A move through the 100-day ($28,821) and 50-day ($28,884) EMAs would support a breakout from R1 ($28,962) to give the bulls a run at R2 ($29,440). However, a fall through the 200-day EMA ($28,501) would bring S1 ($28,232) into view. A BTC move through the 50-day EMA would send a bullish signal.
About the Author
Bob Masonauthor
With over 20 years of experience in the finance industry, Bob has been managing regional teams across Europe and Asia and focusing on analytics across both corporate and financial institutions. Currently he is covering developments relating to the financial markets, including currencies, commodities, alternative asset classes, and global equities.
Did you find this article useful?
Latest news and analysis


Advertisement