
Advertisement
Advertisement
Gold Price Forecast: Analyzing Resistance, Support, and Price Targets
By:
Gold's rally above last week’s high faces resistance, but a breakout could signal higher prices and a shift to a larger uptrend.
In this article:
Gold managed a brief rally above Tuesday’s 2,031 high to trigger a bullish trend continuation before encountering resistance at 2,032. It was the third time in two weeks that the 50-Day MA (orange) was successfully tested as resistance. First, that tells us that the 50-Day line represents resistance that could lead to another drop to test recent lows. Also, it shows the market making another attempt to breakout above the line. The second test was yesterday. Not only was there a new daily high today but there is also a higher daily low, showing that the five-day trend remains well in place.
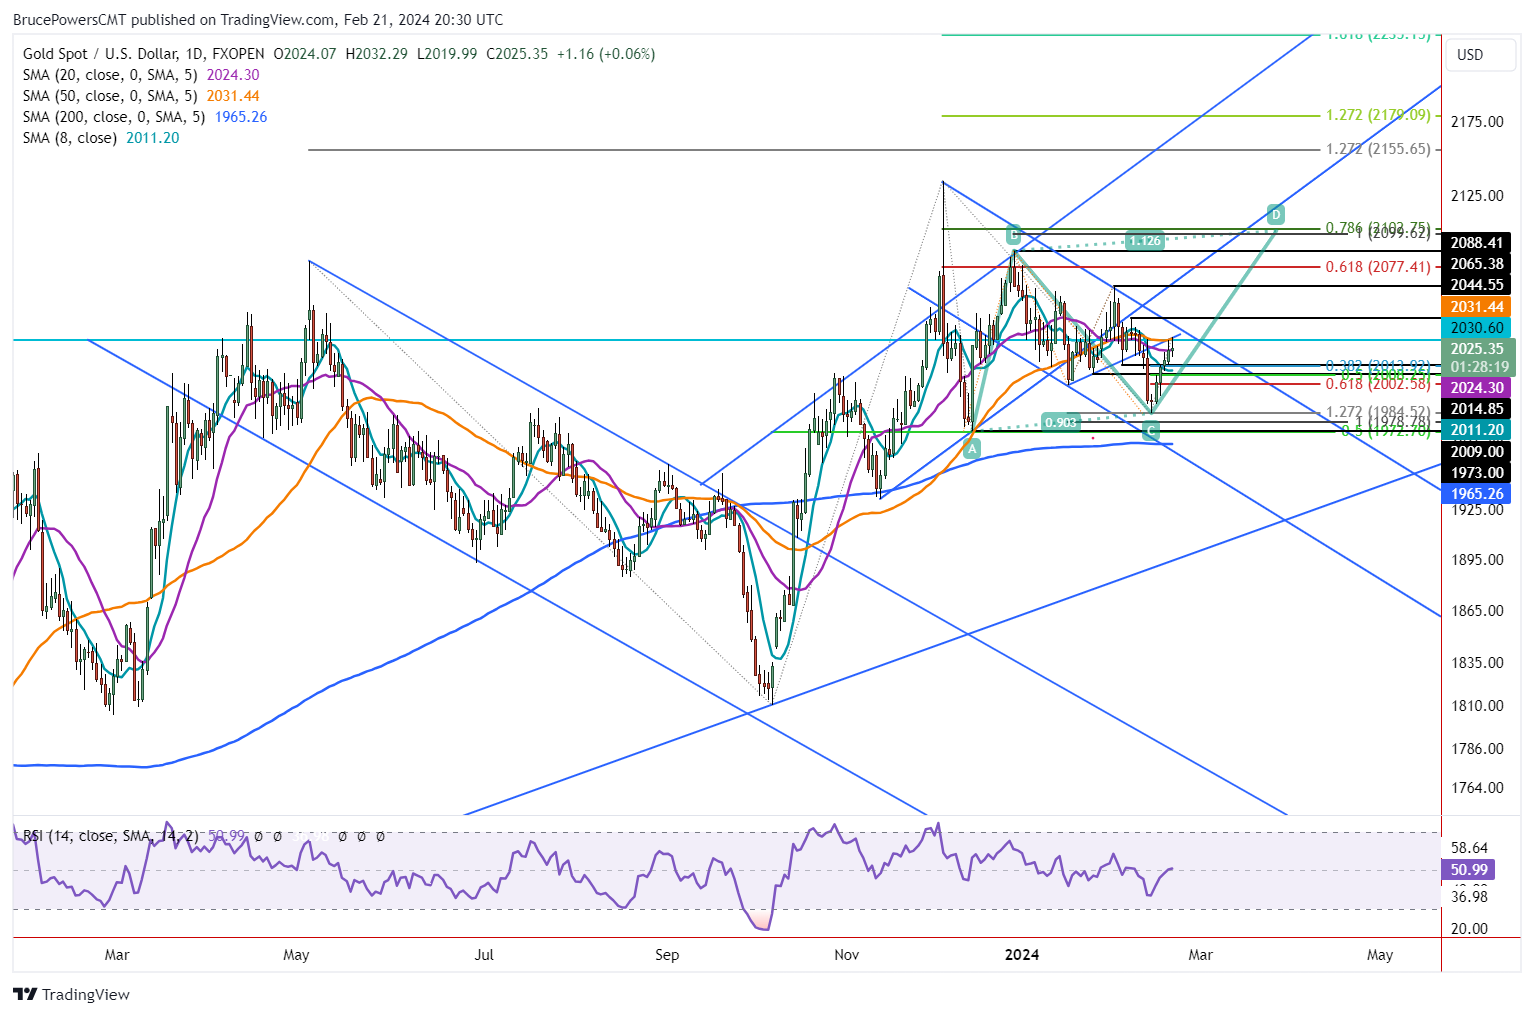
Weekly Bullish Breakout Triggers Above 2.03
Wednesday’s advance also triggered a weekly bullish breakout of last week’s hammer candlestick pattern, which was triggered on a move above 2,031. A daily close above 2,031 will confirm the weekly breakout and put higher prices on the agenda. The first interim target would then be around 2,045. If reached, gold will have risen above the downtrend line, marking a key development reflecting improving demand. Nonetheless, a daily close above the 55-Day MA, now at 2,031, will provide the next sign of strengthening.
Gold is Trying to Break Above 50-Day Moving Average at 2,031
Since today is the fifth consecutive day up for gold, and it continues to test resistance at the 50-Day line, it may lead to a turn down before breaking higher, if it is to do so. In that case, weakness is first indicated on a drop below today’s low of 2,020. There are then two potential support levels to keep an eye on, driven by prior seeing lows. They come in at 2,015 and 2009.
The 38.2% Fibonacci retracement is at 2,014, close enough to confirm the 2,015-price area. Also, the 50% retracement at 2,008 confirms the 2,009-price area as being potentially significant support. A drop below the daily low of 1,995 may lead to a further test of the recent swing low at 1,984, and possibly lower prices. Key lower support is represented by the 200-Day MA, which is currently at 1,965.
Upon Further Signs of Strength, Gold Targets 3,000
Gold has been channeling lower since the late-December swing high at point B. A daily close above the downtrend line marking dynamic resistance of the decline will give the first confirmation that the downtrend has switched to a developing uptrend. At that point, the completion of a rising ABCD pattern at 3,000 (even number) becomes a prime initial target.
For a look at all of today’s economic events, check out our economic calendar.
About the Author
Bruce Powersauthor
Bruce boasts over 20 years in financial markets, holding senior roles such as Head of Trading Strategy at Relentless 13 Capital and Corporate Advisor at Chronos Futures. A CMT® charter holder and MBA in Finance, he's a renowned analyst and media figure, appearing on 150+ TV business shows.
Did you find this article useful?
Latest news and analysis


Advertisement