Intuit Inc. (NASDAQ: INTU) stock price has been super bullish on the charts post the quarterly results. The INTU stock price witnessed a gain of 13% in the past 2 weeks. The bulls have firmly established their positions near the $500 level.
The daily chart shows that the stock price has been maintaining a consistent uptrend for the last 2 quarters adding more than 35% as returns to the investors. INTU’s daily chart also shows a bullish crossover of the EMA indicating a strong trend prevailing in the stock price.
The price action analysis of INTU stock demonstrates that the stock price escaped its consolidation phase after the quarterly results and gained momentum to break above the $500 level. The breakout triggered a short-covering among the sellers and the stock price made a rally gaining 13% in just 2 weeks.
As analysts hope, Intuit’s price may rally more since the stock has a potential of 16% more which could lead the price to touch $642 in the next 1-year. If the price reverts, the stock price can experience a maximum drawdown of 25%, as per the analysts.
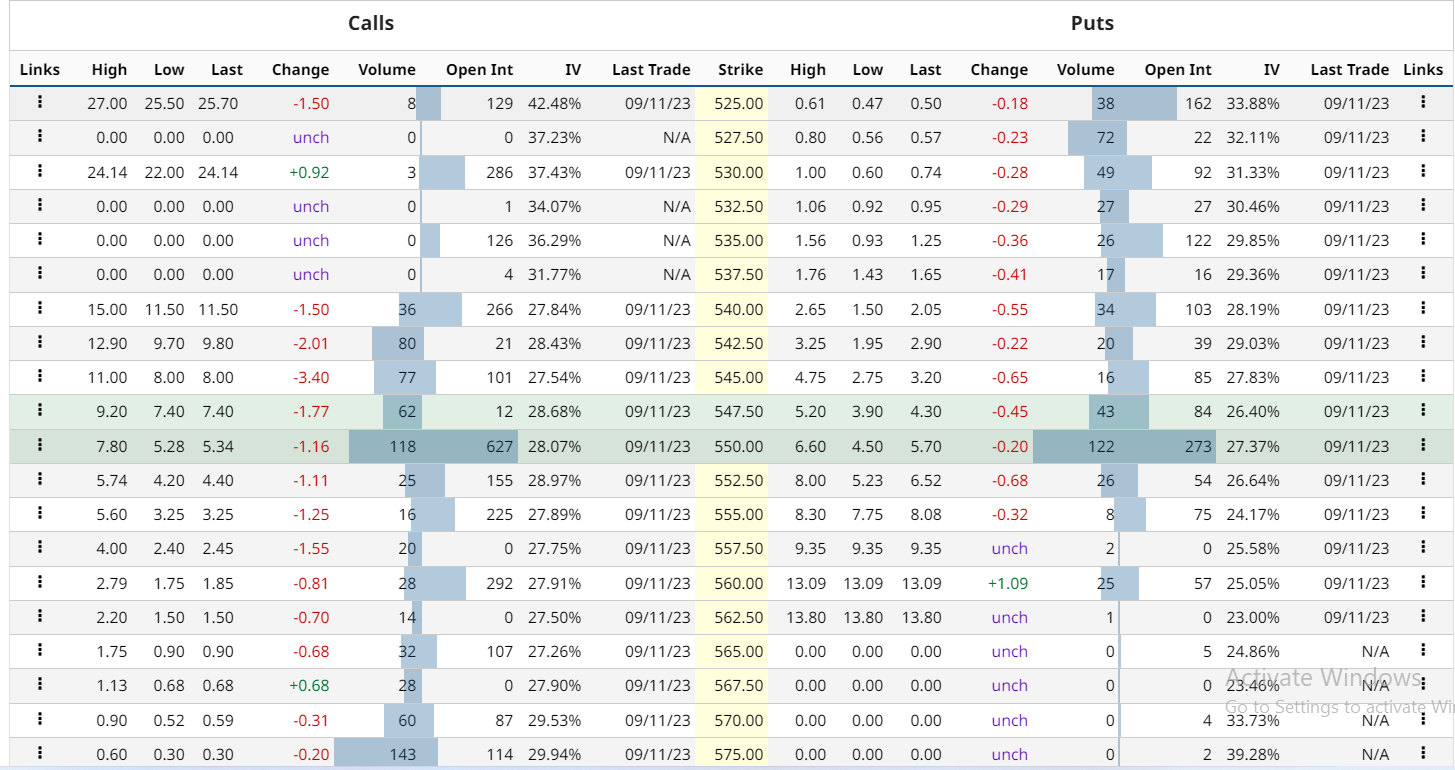
INTU stock option-chain analysis shows that the current implied volatility in the market is 24.47% with a decrement of 0.31% in the last trading session. The nearest resistance of $560 has an OI of 292 open contracts on the CALL side and 57 open contracts on the PUT side, indicating the sellers are dominating the resistance level. Buyers may need to struggle to surpass above the $560 level.
INTU Stock Price Prediction Over the Daily Timeframe
INTU stock price currently trades at $549.30 with an intraday loss of 0.23% on Monday, September 11th. The price has made a breakout of the $500 level and currently trades at $550. The price trades in the bullish territory and may surge to the higher supply levels.
The option chain data shows the dominance of sellers at the $560 level. Hence, more buyers need to accumulate to counter the sellers.
However, the stock has shown a short-term gain which might trigger a profit booking among the investors. The price also might need to sustain the current level to consolidate or make a pullback to gain more.
Technical Indicators Showing Strength Over the Charts
The daily INTU stock price chart shows that the price rebounded from the key moving average of 50 EMA, indicating bullishness in the short term. The RSI and MACD are signaling the stock to be in an overbought region which might trigger selling from the upper levels.
Currently, the overall technical opinion rating, including the RSI and MACD indicators, is signaling a 90% “buy” with a strengthening short-term outlook on maintaining the current direction.
Conclusion
Intuit Inc.’s stock price has been rising steadily for the last two quarters and recently broke above the $500 level. The stock is in a strong uptrend and may reach $642 in a year, according to analysts.
The price is currently at $549.30 and may face resistance at $560. The price may also pull back or consolidate to gain more buyers. The stock has given a 35% return in the last 2 quarters and 13% in the last 2 weeks. The stock is above the EMA and shows bullish momentum.
Technical Levels
- Support levels: $520.41 and $501.74.
- Resistance levels: $556.39 and $579.61.
Disclaimer
The views and opinions stated by the author, or any people named in this article, are for informational purposes only and do not establish financial, investment, or other advice. Investing in or trading crypto or stock comes with a risk of financial loss.
Source: https://www.thecoinrepublic.com/2023/09/12/intu-stock-price-prediction-is-the-trend-fueled-earnings-over/